


Adam Eagleston, CFA
CIO
April 2024: Total Eclipse
Part I – Summary
April Update: Total Eclipse
With the greater Cincinnati area in close proximity to the path of the solar eclipse, we look to the sky for inspiration for this quarter’s update and outlook.
Key Takeaways:
- Totality
- The Magnificent Seven blocked out everything else in 2023.
- However, rays of sun are beginning to appear for stocks outside these tech behemoths.
- With the S&P 500 up double-digits in consecutive quarters, momentum favors continued strength, though valuations do not.
- Umbra
- Despite the market highs, most of the factors we track indicate we have not yet emerged from the shadows.
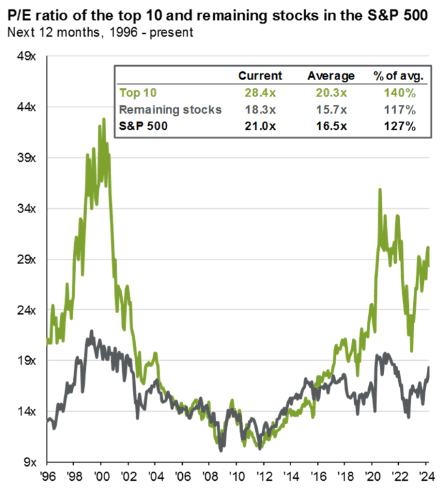
- The S&P 500 remains expensive, with the largest companies the most richly valued.
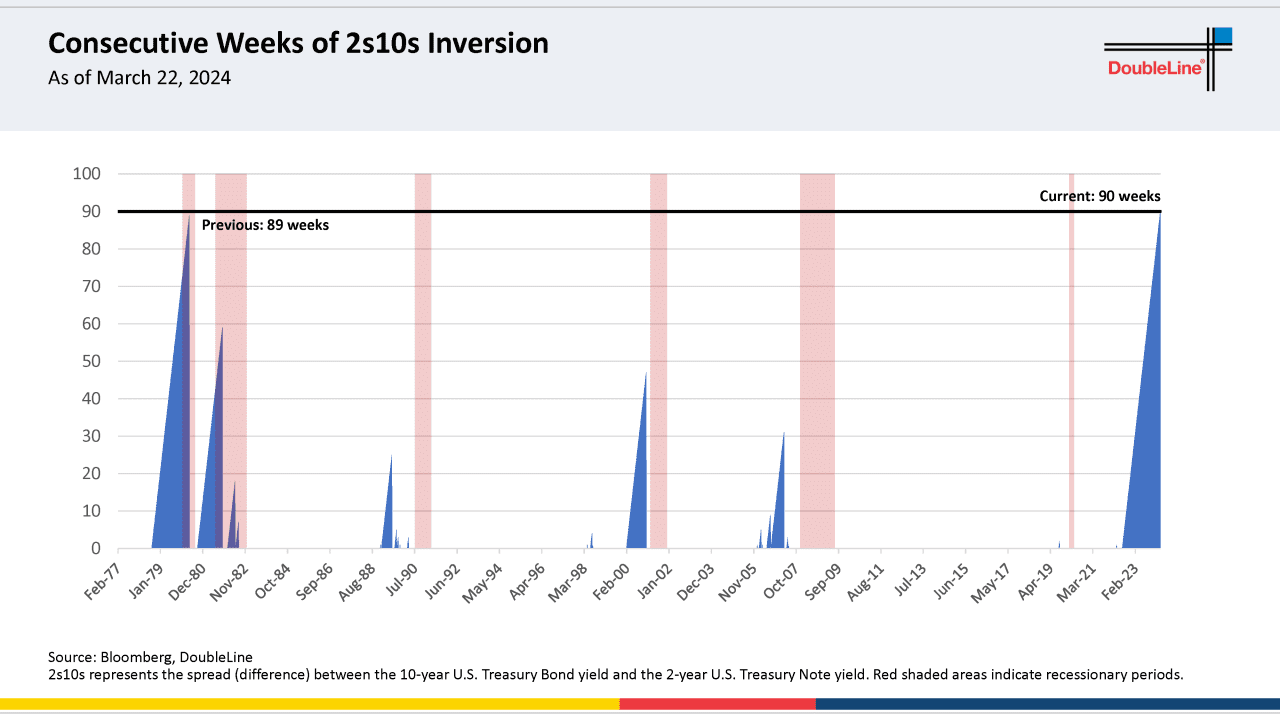
- GDP growth has lowered rate cut expectations, yet the yield curve remains inverted.
- Corona
- Corona is Latin for “crown,” and we lost the king of behavioral finance, Daniel Kahneman, in March.
- The behavior we are seeing is not congruent with some of his findings.
- We are concerned that equity markets have been taken over by speculation.
For those who prefer not to read further, before you close the email, please know these three things.
- The level of concentration in the S&P 500 (34% in the ten largest holdings) is significantly higher than the 27% figure we saw during the tech bubble.
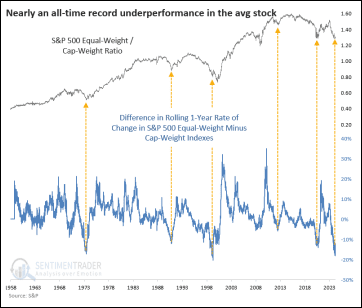
- Underperformance of the average stock versus the index is close to levels seen during the Nifty Fifty and tech bubble (see graph below).
- While momentum remains favorable, valuations and concentration in the S&P 500 Index have us looking elsewhere for opportunity, and keeping an eye on risk.
Part II: Q1 Recap – Totality
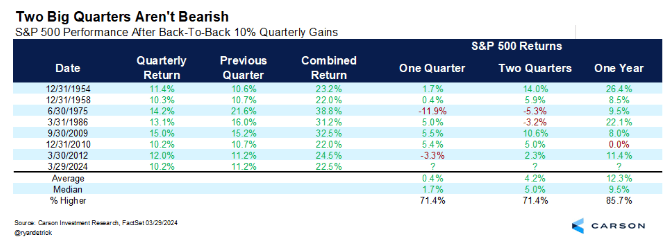
As we see in the following table, strength often begets strength, though valuation was markedly lower during the prior three instances for which we have data:
- 3/30/2012 – 13x
- 12/31/2010 – 15x
- 09/30/2009 – 17x
- Today – 21x
After a strong Q1, the S&P 500 trades at a forward P/E multiple of 21x, a hefty 35% premium to its 20-year average of 15.6x. While much has been made of the rambunctious valuations in the tech sector (59% above its long-term average), the vast majority of the sectors in the index are expensive, too. Only two sectors, Energy and Real Estate, which represent a mere 6% of the market cap weight of the S&P 500, are “cheap”:
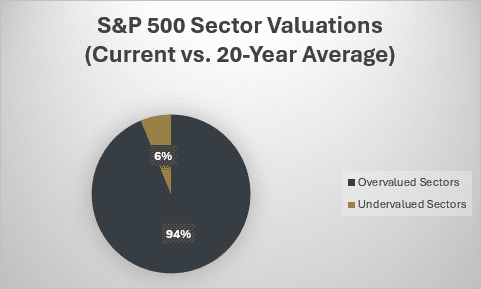
Source: JP Morgan Guide to the Markets
Index returns are certainly reflective of this sentiment as well:
| Index | 1-Month | 3-Month | 1-Year |
| S&P 500 INDEX | 3.22 | 10.55 | 29.86 |
| Invesco S&P 500 Equal Weight E | 4.47 | 7.78 | 19.09 |
| NASDAQ Composite Index | 1.85 | 9.32 | 35.14 |
| Russell 2000 Index | 3.58 | 5.17 | 19.66 |
| MSCI EAFE Index | 3.40 | 5.94 | 15.94 |
| MSCI Emerging Markets Index | 2.50 | 2.41 | 8.50 |
| Bloomberg US Treasury Total Re | 0.64 | -0.96 | 0.05 |
| Bloomberg US Agg Total Return | 0.92 | -0.78 | 1.70 |
| Invesco DB Commodity Index Tra | 4.46 | 4.22 | 1.48 |
Source: Bloomberg (as of most recent month end)
Before we move on, and in homage to Daniel Kahneman (more on him later), let’s look at three hypothetical portfolios, and their returns:
| Year One | Year Two | Ending Value | Total Gain/Loss | |
| Portfolio A | 40% | -40% | 84 | -16% |
| Portfolio B | 17% | -8% | 108 | 8% |
| Portfolio C | 27% | -19% | 103 | 3% |
| Year Two | Year Three | Ending Value | Total Gain/Loss | |
| Portfolio A | -40% | 76% | 106 | 6% |
| Portfolio B | -8% | 8% | 99 | -1% |
| Portfolio C | -19% | 24% | 100 | 0% |
Which would you rather own, or, better yet, which is appropriate for you, given your age and risk profile? Could you tolerate a 40% drawdown emotionally, or would our phone be ringing with you asking to “get me out”?
Kahneman states, “A compelling narrative fosters an illusion of inevitability.” The narrative for the last few years has been big tech is all you need/AI is changing he world. And yet, here are the results. Had you invested in Portfolio A (The Magnificent Seven) at the start of Year One (2021), you would have been down 16% after two years. Portfolio B, the other 493, posted a modest gain, while Portfolio C, the Magnificent Seven-heavy S&P 500 Index, was slightly up. Had you chased the Magnificent Seven after 2021, when valuations were close to the levels we have now. you would have been down 40% after 12 months; the 76% gain in Year Three (2023), saved you. The other portfolios were flat. For all of you excited about the narrative around AI and big tech, are you willing (and able, depending on where you are relative to retirement) to endure this type of volatility?
Q2 Outlook – Umbra
The umbra is the shadow associated with an eclipse. While GDP growth has emerged from the shadows and appears bright, inflation and interest rates darken the outlook. Details on each factor may be found in Part III of the Update.
| More Negative | Neutral | More Positive | |||
| Inflation | ← | ||||
| GDP Growth | → | ||||
| Fed Policy | ≈ | ||||
| Interest Rates | ← | ||||
| Credit Spreads | ≈ | ||||
| Stock Multiples | ≈ | ||||
| Earnings Growth | ≈ | ||||
| Deteriorating | ← | ||||
| Stable | ≈ | ||||
| Improving | → | ||||
Conclusion – Corona
Corona, Latin for crown, is the outermost part of the Sun, and can be seen during an eclipse. From an investment perspective, we lost one of the kings last week with the passing of Daniel Kahneman. His Thinking, Fast and Slow, is one we recommend for all of our new investment hires, given its comprehensive analysis of behavioral finance. The slightly more approachable version would be Michael Lewis’ The Undoing Project, written before Lewis became an apologist for a convicted felon…
“Losses loom larger than gains” is one of the key concepts put forth by Kahneman. While Kahneman’s research explains why, the type of behavior we are currently witnessing is incongruent with loss aversion. Post-Covid, we have seen an explosion in speculation and risk taking; here are three examples:
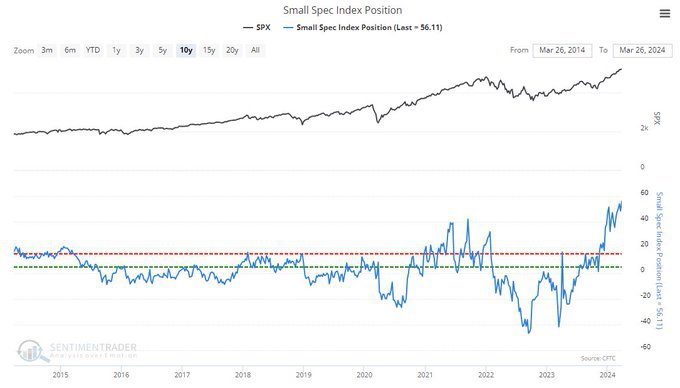
- Small investors, who are “all in.” Retail investors are normally not the greatest at timing markets (prior peak was late 2021, right before a major decline in 2022), and the percentage of consumers expecting stocks to rise has jumped to the 2nd-highest in history, per SentimenTrader:
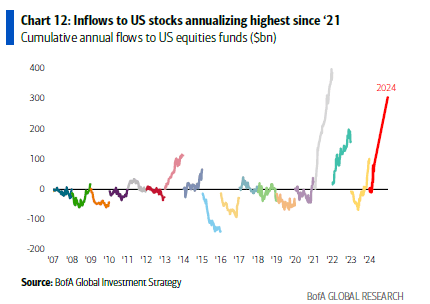
- Inflows to equity funds are running at their highest pace since 2021:
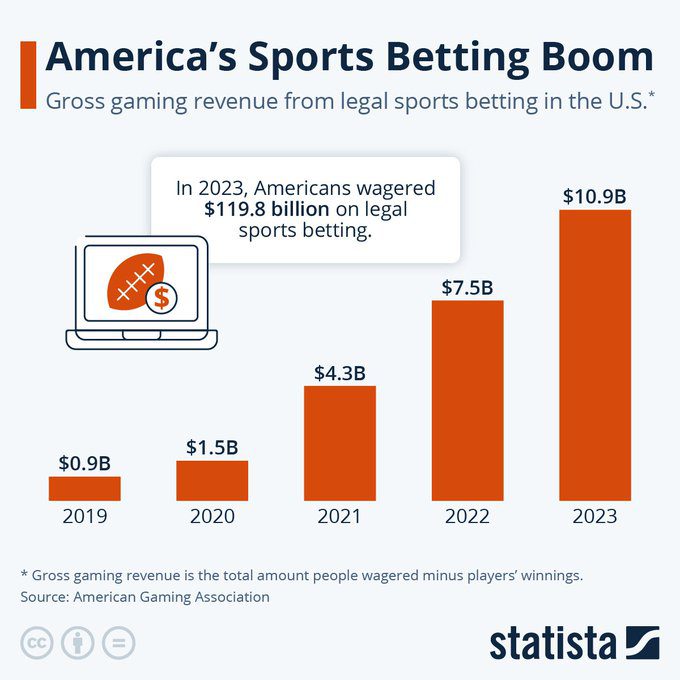
- While not directly market related, sports gambling has boomed post-Covid. Yes, changing regulations and accessibility are at play, but is there much difference between betting on sports via an App and day trading stocks via an app?
“An inability to be guided by a “healthy fear” of bad consequences is a disastrous flaw,” per Kahneman. Currently, the only fear we are seeing is fear of missing out. It is easy to see why no one is considering bad consequences, as we are currently experiencing the third longest streak without a major (2%) decline in the S&P 500 Index. The current streak has seen the highest return during the preceding 12 months versus prior occurrences. While it is easy to become complacent, investors should be aware that once the streak was broken, volatility tended to escalate, with two corrections (2007 and 2015) and one bear market (2018). However, the good news is that no prior streak ended with a significant loss for the index over the following twelve months:
| S&P 500 Index Days Since 2% Daily Decline | |||||
| Date Ended | Duration (Days) | Prior 12-month return | Next 12-month return | Peak Gain | Maximum Drawdown |
| 2/27/2007 | 950 | 14.5% | -0.9% | 12.5% | -17.7% |
| 2/2/2018 | 352 | 26.3% | -0.1% | 7.4% | -20.7% |
| 3/27/2024 | 276 | 34.0% | TBD | TBD | TBD |
| 6/29/2015 | 180 | 9.4% | 4.0% | 4.9% | -13.3% |
| 1/24/2014 | 150 | 24.9% | 17.0% | 19.1% | -8.3% |
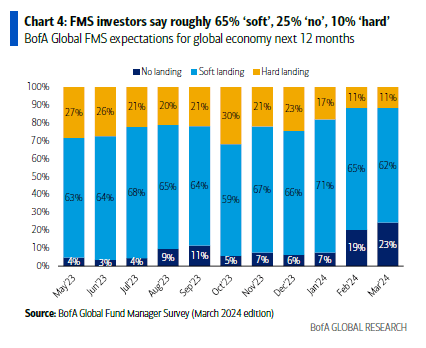
As Kahneman states, “We know that people can maintain an unshakable faith in any proposition, however absurd, when they are sustained by a community of like-minded believers.” Close to 90% of investors see a soft or no landing scenario:
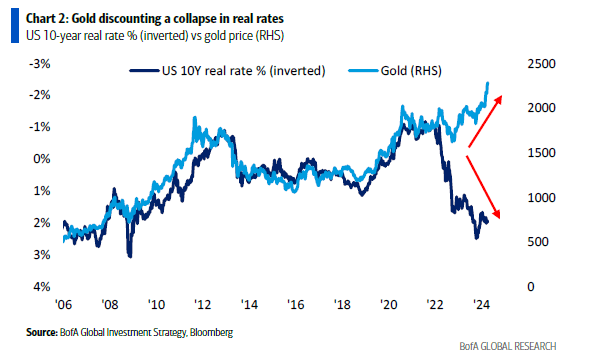
However, gold prices have become untethered from real rates, driven in part by massive central bank purchases of gold. From a U.S. perspective, this chasm means that investors are betting on a collapse in real rates, which would be a function of drastic Fed rate cuts and/or higher inflation, neither of which is a panacea for equities, which are pricing this soft-landing scenario by a 2:1 margin.
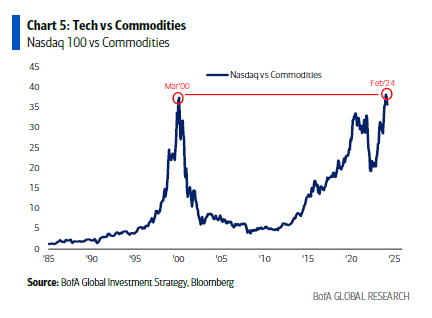
With the strong momentum in equities, we maintain our optimism, albeit in areas that, as Will states, are things you can drop on your foot. To that end, commodities are as cheap versus tech stocks as they have been since the early 1980s, and we continue to look outside the tech-heavy, overvalued portions of the S&P 500 for opportunities, and keep our eyes on the skies for risks that are being widely ignored, e.g., worsening geopolitics and the explosion in both government debt and interest expense.
Part III: In-depth analysis of Key Factors
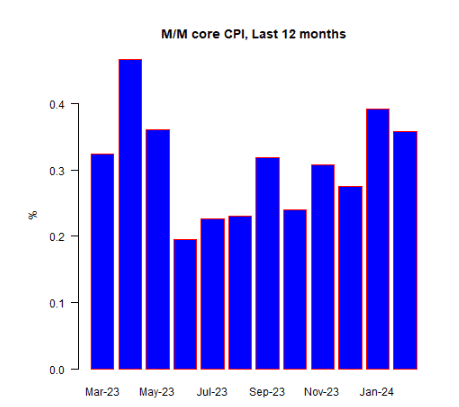
- Inflation – Negative and deteriorating. Both January and February inflation prints came in above expectations. However, as Reuters states, “Powell’s comments were in line with his remarks after the Fed’s policy meeting last week, in which he said higher-than-expected inflation in January and February had not changed the sense that price rises would keep falling this year to the central bank’s 2% target.” While the Fed has dismissed these as bumps on the path toward 2%, we see it as a sign that inflation is stickier than expected.
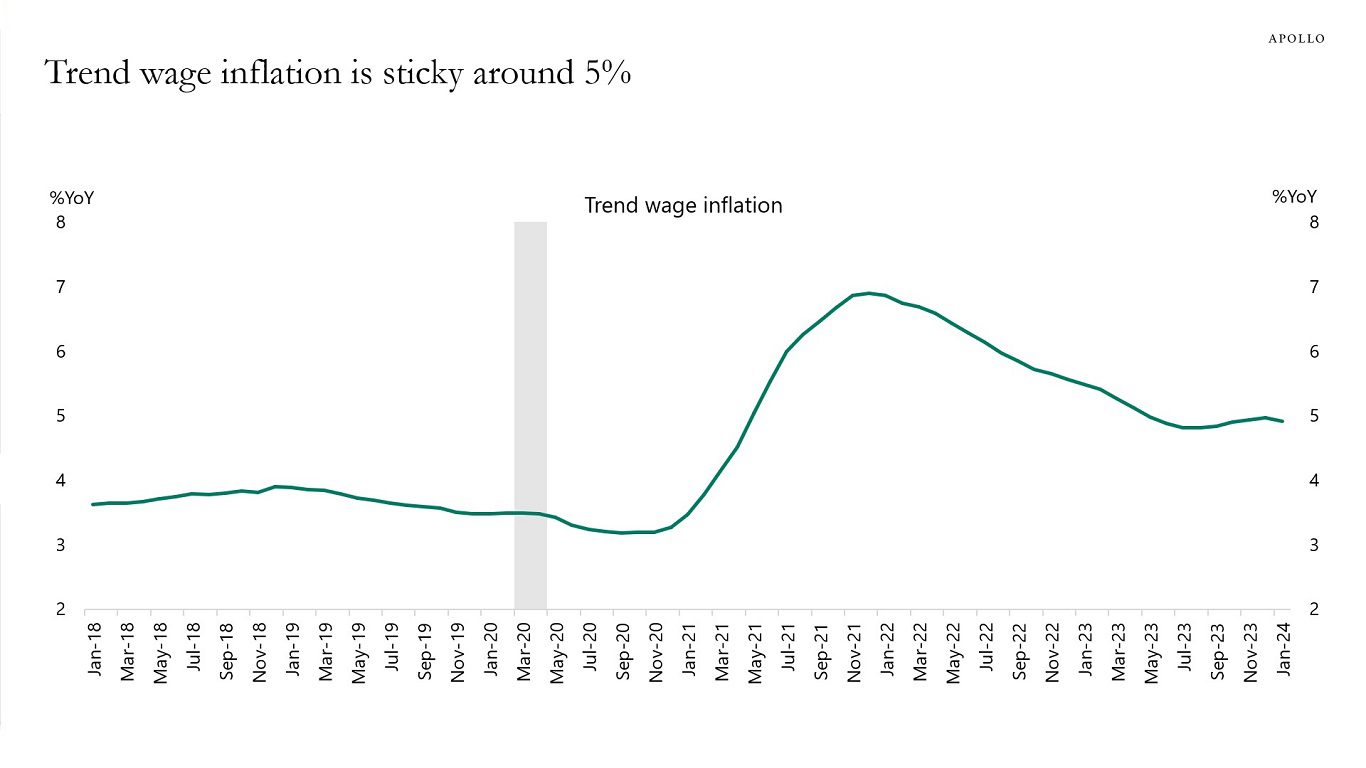
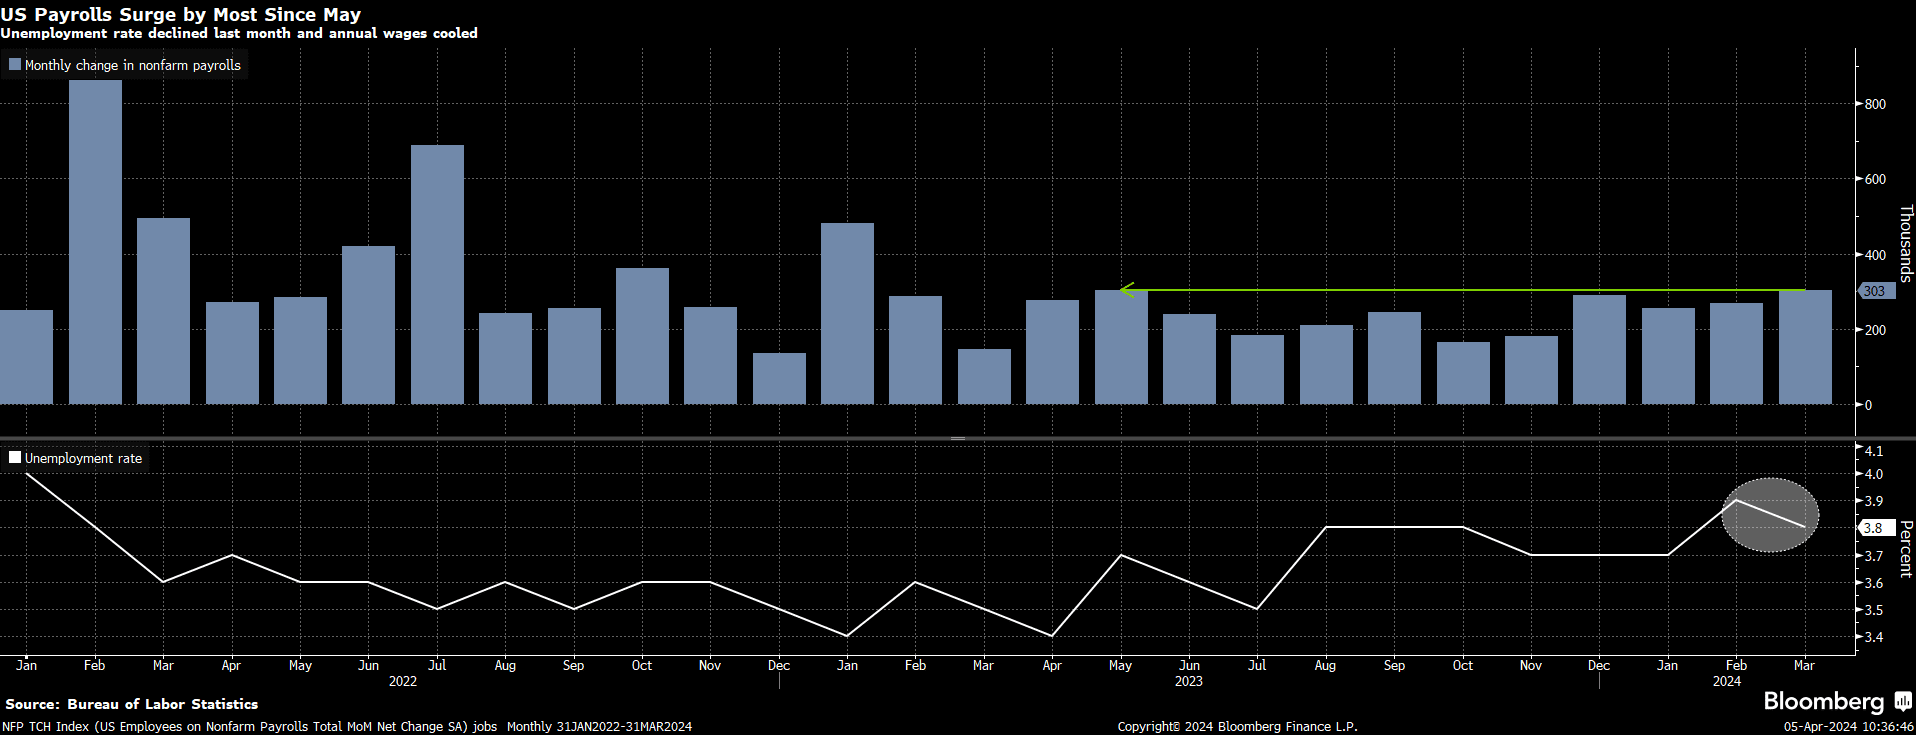
For us, wage inflation is a key factor, and that shows no sign of relenting with the economy running hot:
- GDP Growth – Positive and improving. Employment data remains strong, and both nominal and real growth continue to surprise to the upside:
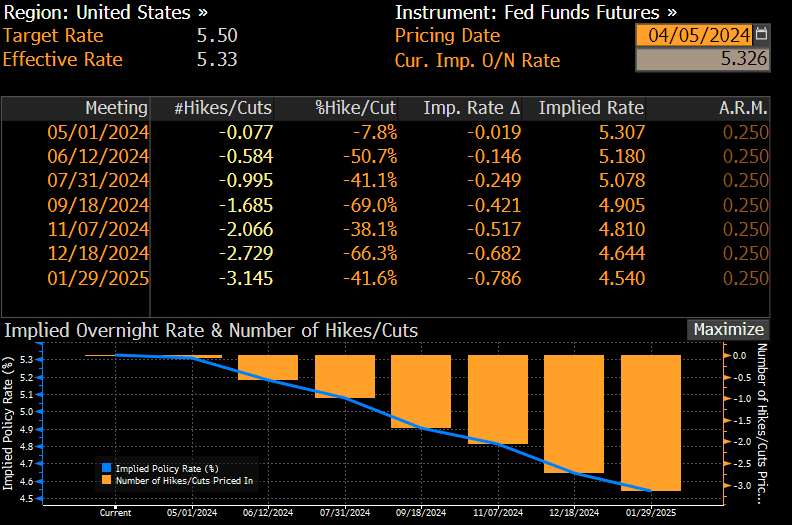
- Fed Policy – Negative and stable. Since November, Chair Powell has gone out of his way to be dovish. As he stated this week, “If the economy evolves broadly as we expect, most FOMC participants see it as likely to be appropriate to begin lowering the policy rate at some point this year.” Market expectations are for three cuts in 2024, in spite of the recent uptick in inflation we mentioned. However, this is half as many cuts as the market was anticipating at the start of the year:
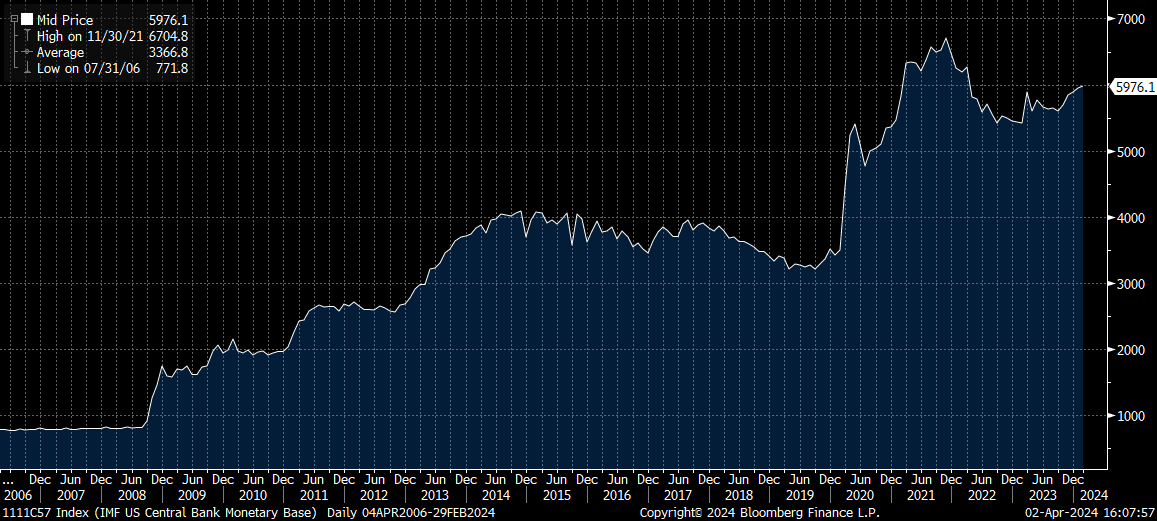
For all the talk about the Fed shrinking its balance sheet, the monetary base has grown since the banking crisis of March 2023:
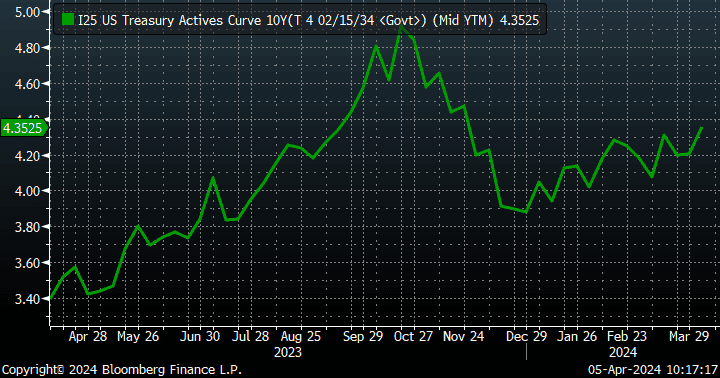
- Interest rates – Negative and worsening. The 10-year Treasury yield moved from around 3.9% to start the year up to 4.35%. The inversion in the 2-10 curve now exceeds its previous record length and stands at over 90 weeks:
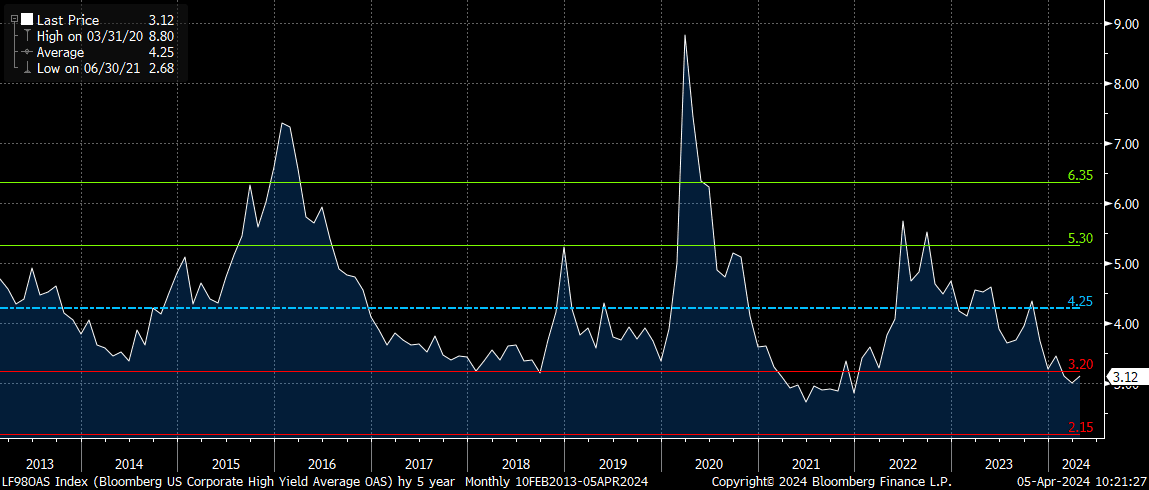
- Credit spreads – Negative and stable. A reminder we use this as a contrarian indicator. In other words, if we see spreads widening into the area above the green line, we may start to view risk/reward more favorably. High-yield spreads and investment grade spreads are tight:
- Stock multiples – Negative but stable. Large cap stocks are not cheap at the index level; only two of 11 sectors trade below their 20-year average (Energy and Real Estate). The top ten stocks are even more overvalued, and the S&P 500 Index is as concentrated as it has even been, with 34% of the index in the top 10 holdings:
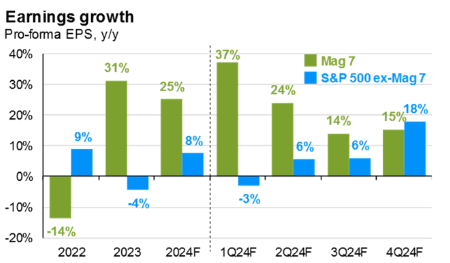
- Earnings growth – Negative but stable. Excluding the Magnificent Seven, earnings growth was dreadful, but since these companies carry such a heavy weight in the index, this weakness was obfuscated at the index level. Expectations are incredibly high for both the Magnificent Seven and the other 493 in 2024:
READY TO TALK?