January Update: The Dorian Gray Market
We are done with memes as a theme. The market, however, seemingly is not. Look no further than December 23, when a giant ape was delivered to oppose the famous Wall Street bull. A little too on the nose, as far as symbols go.

This puts a nice holiday bow on 2021, which could be chalked up as the year of the retail investor. A few stats from this FT article on the influence of retail investors, written by Ruchir Sharma, Morgan Stanley’s chief global strategist, are worth highlighting:
- S. investors bought more than $1 trillion in equities in 2021, three times the previous record and more than the prior 20 years combined.
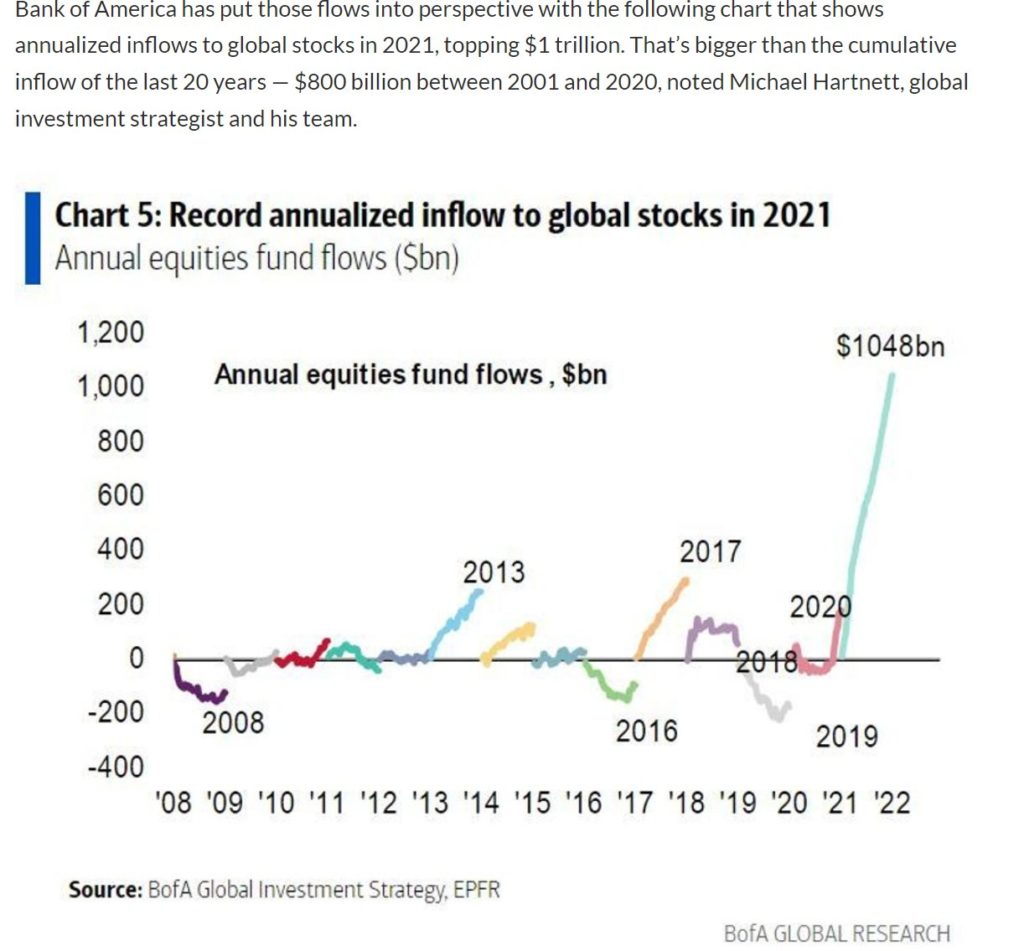
- Households own 12 times more stock than hedge funds.
- Net margin debt, i.e., borrowing to buy stocks, is 2% of GDP, a record high and a 50% year-over-year increase.
This article from Bloomberg provides a fascinating take on 2021, and shows that in Q2, over 20 million were actively using Robinhood accounts on a monthly basis. It also cites Hunter S. Thompson, whose quote, “when the going gets weird, the weird turn pro” captures the zeitgeist of last year.

Our experience in 2021 reminds us of one of my favorite books, The Picture of Dorian Gray. To make a moderately long story short, the titular character’s misdeeds are masked by his beautiful appearance, while a hidden painting bears the gruesome scars of his descent into depravity. Also, he probably wore a cape, which is returning as a fashion choice, and not just for superheroes or your father’s divorce attorney.
This same phenomenon is something we saw within equity markets in 2021. While stocks, as measured by the S&P 500 Index, had a beautiful year, the average stock, while not gruesome, was certainly not nearly as attractive, to put it mildly.
We will look back at 2021 and ahead to 2022 using some of the novel’s most quotable lines.

Experience is merely the name men gave to their mistakes.
So, the experience many of us had in 2021 was not owning enough megacap tech. While the dispersion was large pre-COVID, the move off the March 2020 lows is simply staggering, and grew larger throughout the course of 2021.
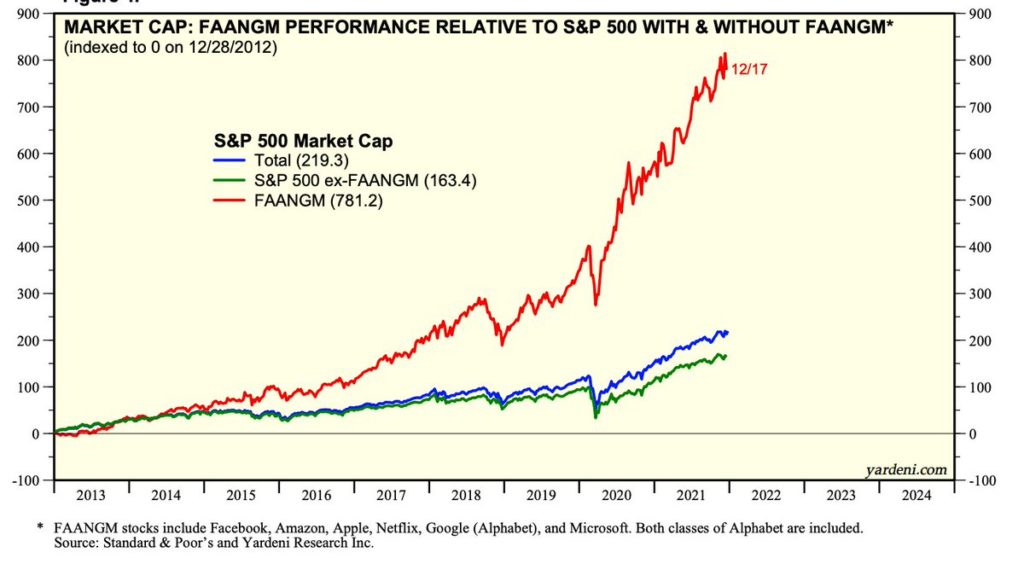
As we start 2022, it is more of the same, with Apple becoming the first company to achieve a market cap of $3 trillion, which makes it larger than the entire German stock market. Apple has added over $2 trillion in market cap since March 2020.

To define is to limit.
Arguably, this should be the Fed’s tag line. By defining inflation in a very narrow sense, they are limiting it, though to be fair this graph summarizes reality:
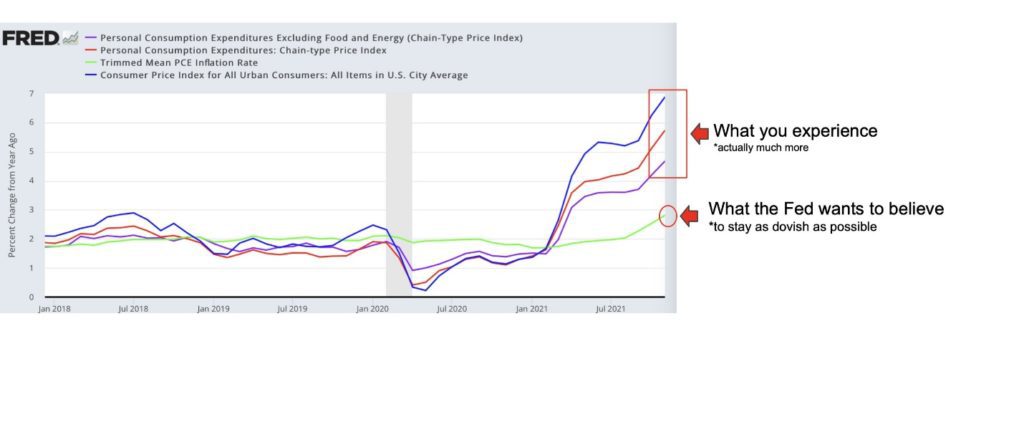
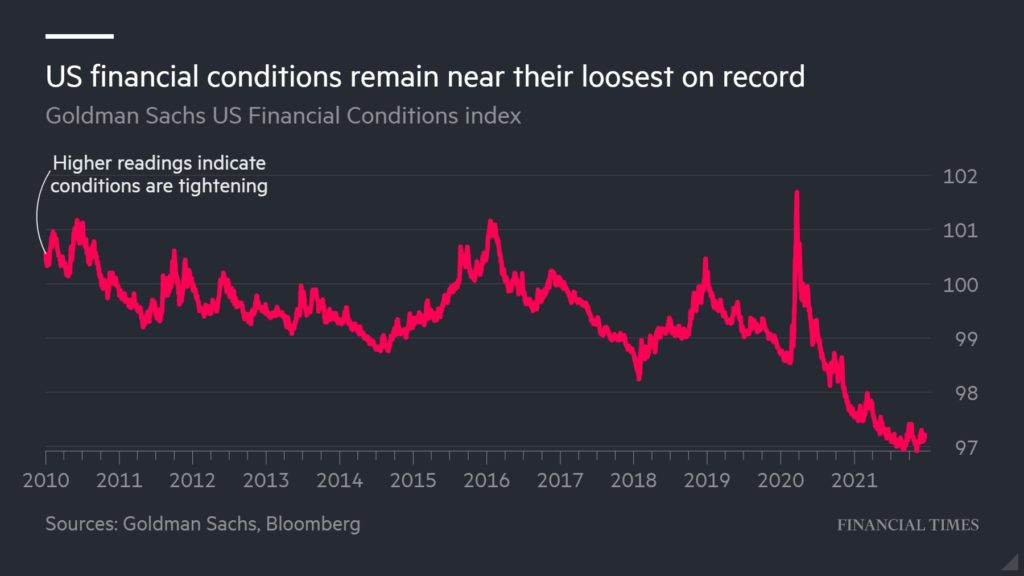
The reason? From this Bloomberg article, “The aggregate money supply has increased by $21 trillion since the start of 2020 in the U.S., China, euro zone, Japan and eight other developed economies.” This deluge of liquidity has boosted assets of all stripes, especially speculative ones, and is a primary reason financial conditions remain almost as loose as they have ever been.
However, while levels are important, directions and rates of change often matter more. With that, as well as growing political pressure in an election year to tame inflation, the market is anticipating not only a taper of the Fed’s balance sheet but also a series of increases in the Federal Funds rates. This graph from Charlie Bilello indicates the market pricing four (4) increases in 2022, while the Fed’s own “dot plot” implies three (3) 25 bp rate increases.

Again, tapering does not mean shrinking its balance sheet, only that the Fed (and central banks across the globe) will be buying fewer bonds (theoretically). In other words, the direction of change is toward tighter monetary policy.

Some things are more precious because they don’t last long.
Pretty sure Oscar Wilde did not have omicron in mind here, and unsure anyone would consider a virus precious, but certainly if it keeps going at this rate it may indeed not last long. This rampant mutation is one thig that could also change the calculus of global central banks vis-à-vis tighter monetary policy.
While governments in Europe, Canada, and China have reimposed severe lockdowns in an effort to stem the spread, the experience a lot of us had over the recent holidays suggest Americans are moving in a different direction on that front, almost as if officials are seeing the following graphics as being inevitabilities.

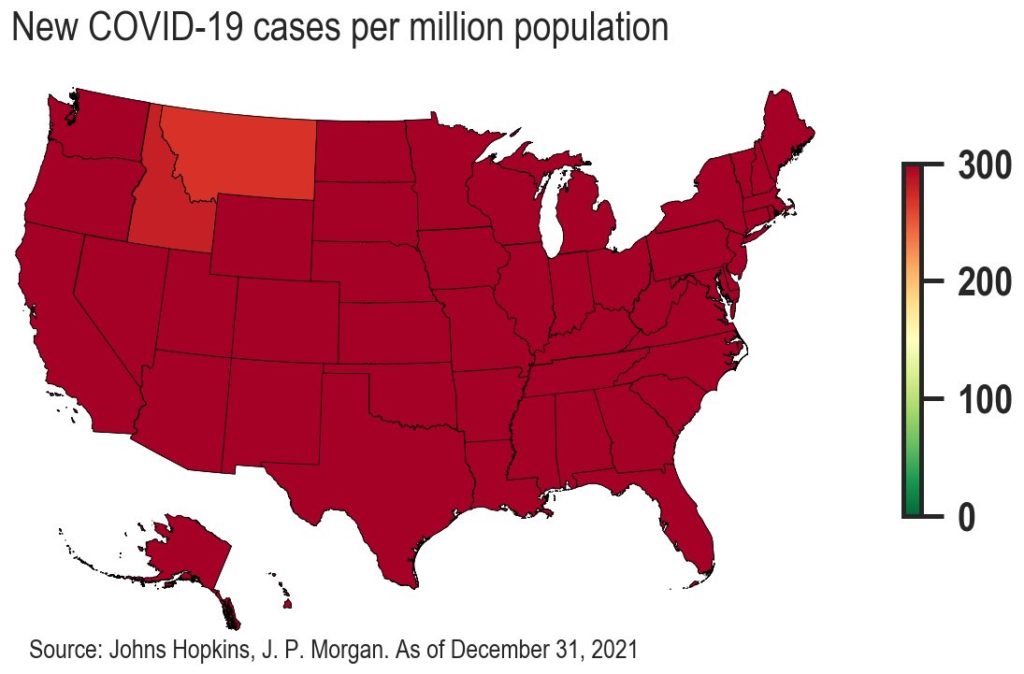
These shocking stats probably belie an even worse reality, given the increasing usage of at home tests that may make reported cases systematically lower. For frame of reference, average daily cases are now 410k, approximately 60% higher than the prior peak from January 2021.
Optimists report on the below peak trends for hospitalizations and deaths, supporting the contention that omicron may be less severe. Here is data for London, which may be seen as a microcosm.
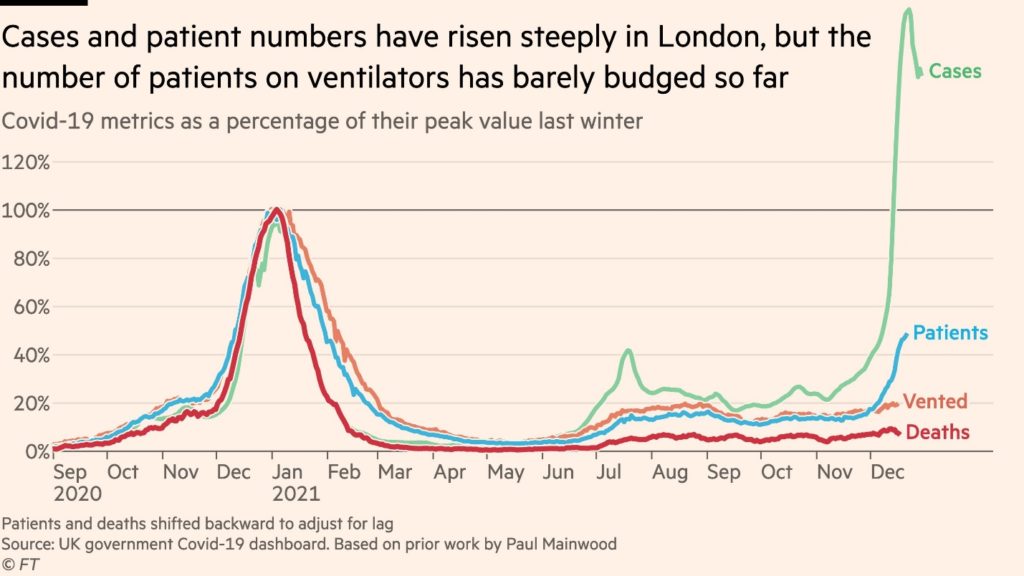
However, the human cost in terms of the long-term effects of all strains of Covid remains to be fully understood, and we believe is reshaping the landscape from a societal perspective in terms of things like workforce engagement.
Nowadays people know the price of everything and the value of nothing.
Truer words have never been said. Ask anyone the price of their favorite stock or cryptocurrency, and they can find it instantly; they probably looked at it within the last hour, to be fair. The value, on the other hand, we have our doubts.
Again, we do not want to disparage retail traders and neophytes, but the boom in online trading has coincided with one of the great speculative asset booms in living memory, with every single dip having been bought with a vengeance. Increasingly, these retail speculators are turning to esoteric leverage and inverse ETFs, which have seen their assets double over the past two years.

Moreover, the winners have been predominantly retail favorites and American household names. In fact, we have not seen this type of outperformance by U.S. stocks since, you guessed it, the technology bubble.

So, back to the “value of nothing” part of the quote. Eventually, this should matter.
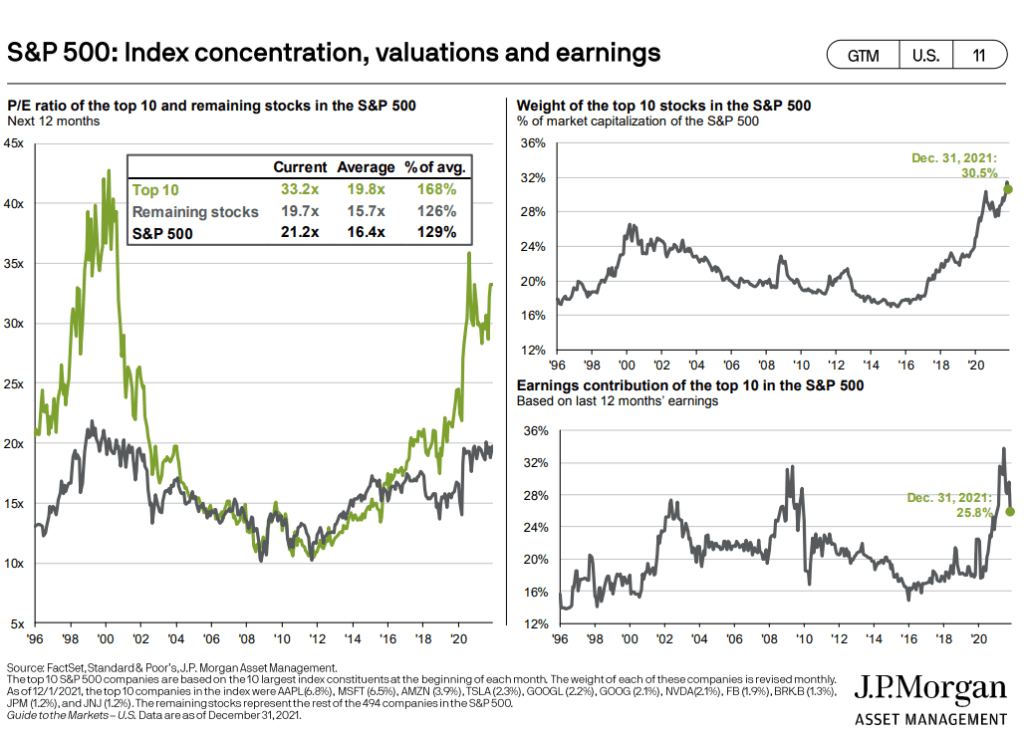
Working our way around this graph, we see the top 10 companies in the S&P 500 are at a hefty 33x P/e multiple. Could it go higher? It sure did during the tech bubble. Does paying almost 70% above the average multiple likely tilt the odds in our favor for generating performance at this point? Perhaps not. While the remaining 490 names are not cheap (20x), they are far less stretched (26% premium to history). The index is also as heavily weighted in the top 10 as ever, and those 10 names are contributing a declining percentage of the index’s revenue. Again, not a great setup, but indicative of this Dorian Gray mask the S&P 500 Index possesses.
So, what is overtly ugly? Sadly, for those of us who have spent careers analyzing smaller companies, the answer is obvious. Including the financial crisis, small caps (circled in red) have been the worst factor (lowest return and highest volatility). For those of us who prefer value (circled in yellow), it has been a double whammy, with value the second worst on both fronts. Not to belabor our Apple market cap trivia, but, at $3.5 trillion, the market cap of the entire Russell 2000 Index of small cap companies is barely large than Apple.

The combination of the two, i.e., small cap value, is the only market segment that trades at a valuation below its long-term history. However, if you want valuation discrepancies, let’s not give short shrift to non-U.S. companies, as the outperformance of U.S equities we referenced earlier has led to a massive valuation discount for international equities. To be fair, some of these differences can be attributed to a higher weight in cyclical sectors outside the U.S., but valuations are cheap however you look at it.

The only way to get rid of temptation is to yield to it.
We think a lot of people are yielding to temptation right now. We have talked in the past about the level of call option buying and fear of missing out (FOMO) fueled purchases made by those who do not want to be accused of missing a boat that, in our opinion, has probably already left the harbor (probably a little too soon for cruise humor for some of us…)
However, when comparing the performance of broad indices, it is easy to make the case just to own the recent winners and call it a day.
| Index | 1-Month | 3-Month | YTD |
| S&P 500 INDEX | 4.47 | 11.02 | 28.68 |
| Invesco S&P 500 Equal Weight E | 6.27 | 8.95 | 29.41 |
| NASDAQ Composite Index | 0.75 | 8.47 | 22.21 |
| Russell 2000 Index | 2.23 | 2.12 | 14.78 |
| MSCI EAFE Index | 5.13 | 2.74 | 11.86 |
| MSCI Emerging Markets Index | 1.81 | -1.36 | -2.47 |
| Bloomberg US Agg Total Return | -0.26 | 0.01 | -1.54 |
| Bloomberg US Treasury Total Re | -0.51 | 0.18 | -2.32 |
Source: Bloomberg (as of most recent month end)
However, doing what is easy is not our thing, nor is it prudent at this point; sort of like driving in the rear-view mirror. While any effort toward diversification away from large cap and technology was unsuccessful in 2021, we do not believe this trend can persist in perpetuity.
The basis of optimism is sheer terror.
Oscar Wilde was certainly not one for understatement, as you can see from the above quote. While it would be hyperbole to state optimism over 2022 is rooted in terror (sheer or otherwise), we find both causes for optimism as well as trepidation.
- The trend
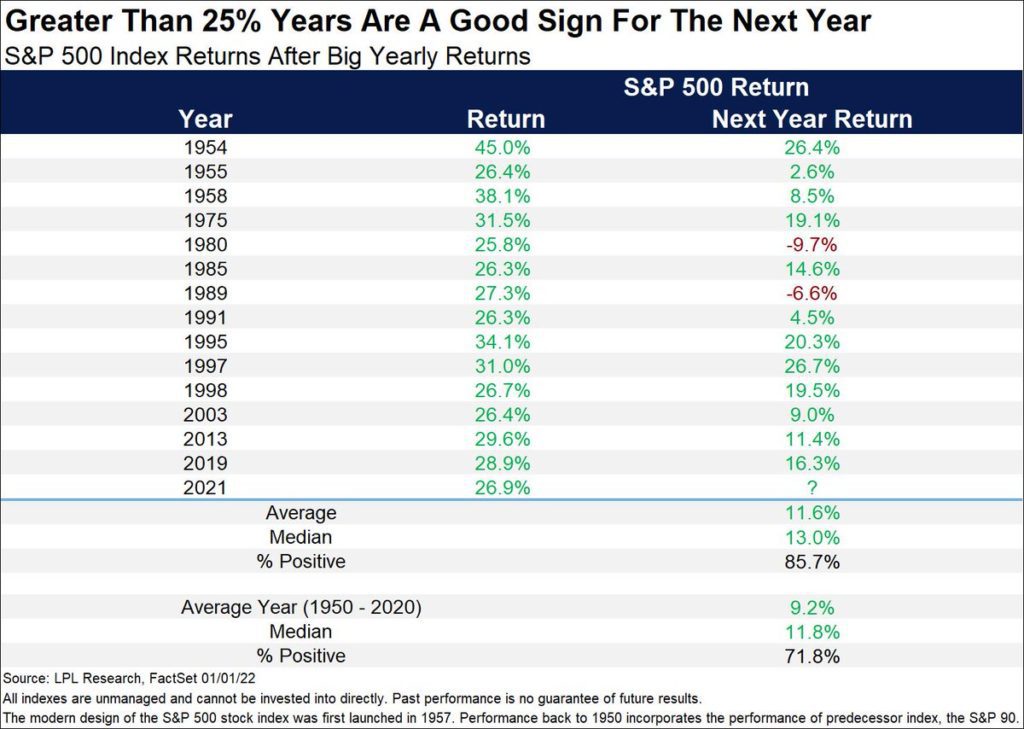
- Optimism – The trend is your friend, as in a great year is normally followed by another positive year.
- Trepidation – The next year has never been as great (for the index), so manage your expectations and do not chase returns.
- Inflation
- Optimism – Because certain inflation measures have been so elevated, inflation should moderate due to the math of how it is calculated.
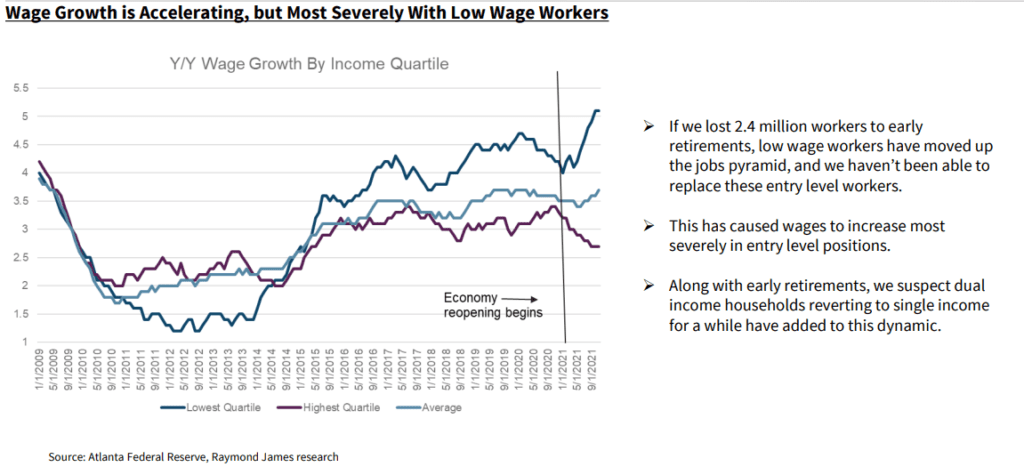
- Trepidation – It may cool but maintain a relatively high level that forces the Fed to act, to the degree its tools are able to counteract things like wage inflation, which are looking more structural. Also, let’s not forget about supply chains, especially as China’s zero Covid policy faces omicron.

- Valuation
- Optimism – There are values to be found in certain parts of the market.
- Trepidation – The largest sectors of the market are as expensive as ever and may not be able to endure tighetr monetary policy and/or inflation, given valuations.

Always. That is a dreadful word.
“Markets always go up. You should always buy the dip. The Fed always has your back.” Oscar was on to something here with “always” being a terrible word.
Sure, during the incredibly short history today’s batch of retail speculators has “investing” in stocks, cryptocurrencies, etc. these things may have always been true.
However, the first few days of 2022 are showing us a markedly different picture on the side of the investment business that is most decidely not retail oriented, that being fixed income. Yields on U.S. Treasuries have moved sharply higher across most parts of the curve (the green line is as of today (1/4) while the gold line is one week ago).
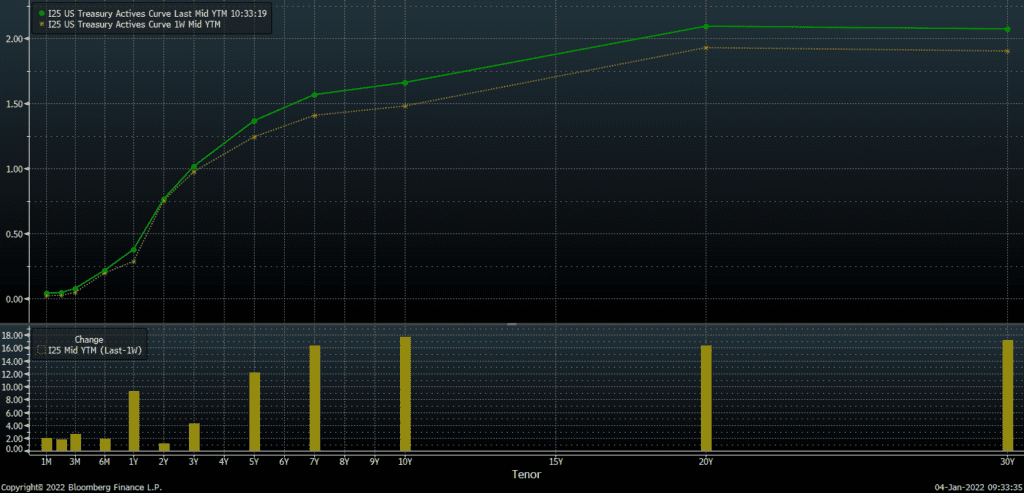
One thing we would say that defies the “always” paradox is that predictions are always wrong. Accordingly, we would not dare offer one. All we can say is that after a three-year spell where the S&P 500 Index’s return has tripled its historical average, expectations for 2022 may be too high, and concerns over a drawdown may be too low. As a reminder, the average intrayear drop for the S&P since 1980, an era dominated by declining interest rates, has been 14%; last year, we came nowhere near even half of that level.
To close with one final quote, “as for believing things, I can believe anything, provided that it is quite incredible.” At this point, the most incredible thing to believe would be a Fed committed to truly restrained monetary policy. However, even today, a trial balloon was floated in the Wall St. Journal. Here, the talk is not of tapering, but of, gasp, reducing the size of the Fed’s balance sheet.
The novel ends with Dorian stabbing the portrait that shows his gruesome misdeeds in an effort to get rid of the evidence of his crimes. However, in the course of doing so, he kills himself. Will the Fed’s efforts at righting its inflationary wrongs lead it (and the market) to a similarly self-destructive fate?
READY TO TALK?
