


Adam Eagleston, CFA
CIO
July 2024: Jenga
Part I – Summary
July Update: Jenga
We are privileged to work with insightful people here at Formidable, and during a recent call one of our colleagues mentioned how the current market reminds him of Jenga. Accordingly, in the spirit of family vacation rainy day activities, we will use Jenga (and a few other games) as inspiration this quarter.
Key Takeaways:
- Jenga
- Whether it’s the level of index concentration or outperformance by the biggest stocks, the S&P 500 looks like a late-stage Jenga tower.
- Unlike in Q1, where we saw broader participation, Q2 was historically narrow.
- While broad market momentum favors the upward trend, the narrow base has historically been a challenge to overcome.
- Life
- The game of Life starts with choosing a career path, though the job market in real life is becoming more challenging.
- The other factors we track tend to point toward a more difficult life for investors.
- However, GDP growth remains positive.
- Stratego
- Unlike in most board games, the risks in Stratego are unknown…
- …until you run into a bomb.
- We are concerned that equity markets have been taken over by speculation but hopefully we are nearing the end of an era of narrow performance.
For those who prefer not to read further, before you close the email, please know these three things.
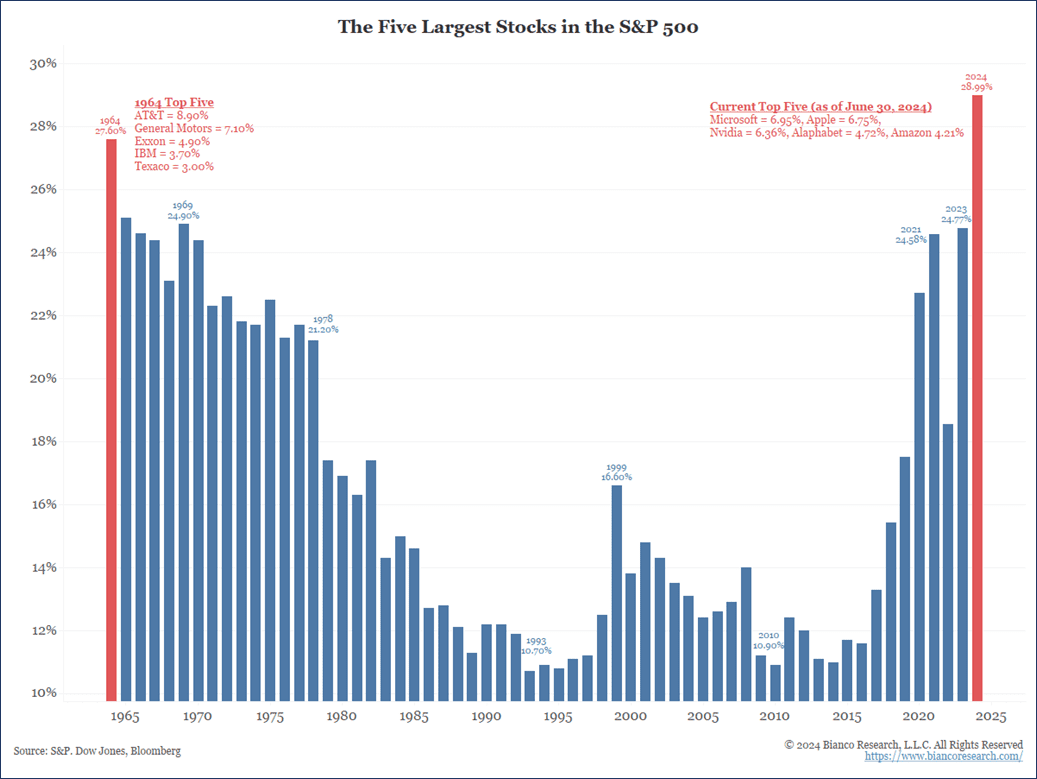
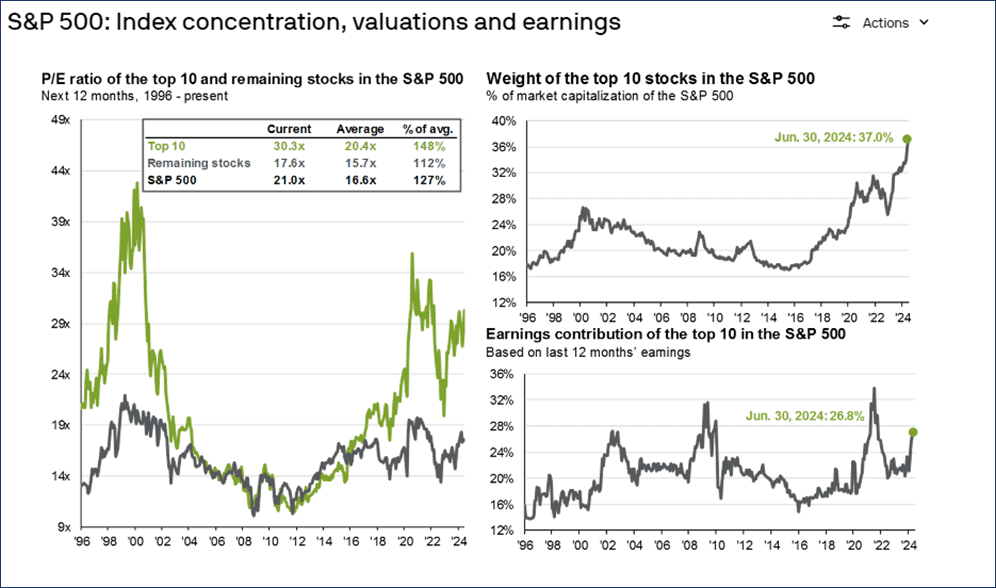
- The level of concentration in the S&P 500 (37% in the ten largest holdings) is significantly higher than the 27% figure we saw during the tech bubble or the 32% at the end of 2021.
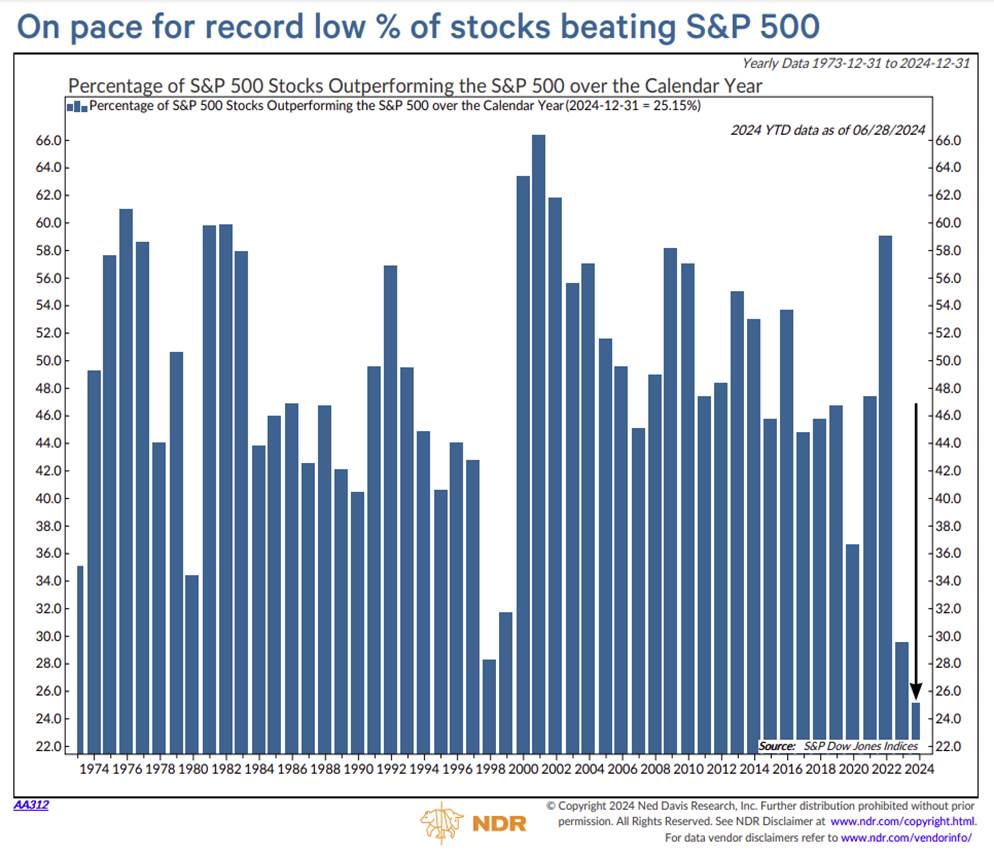
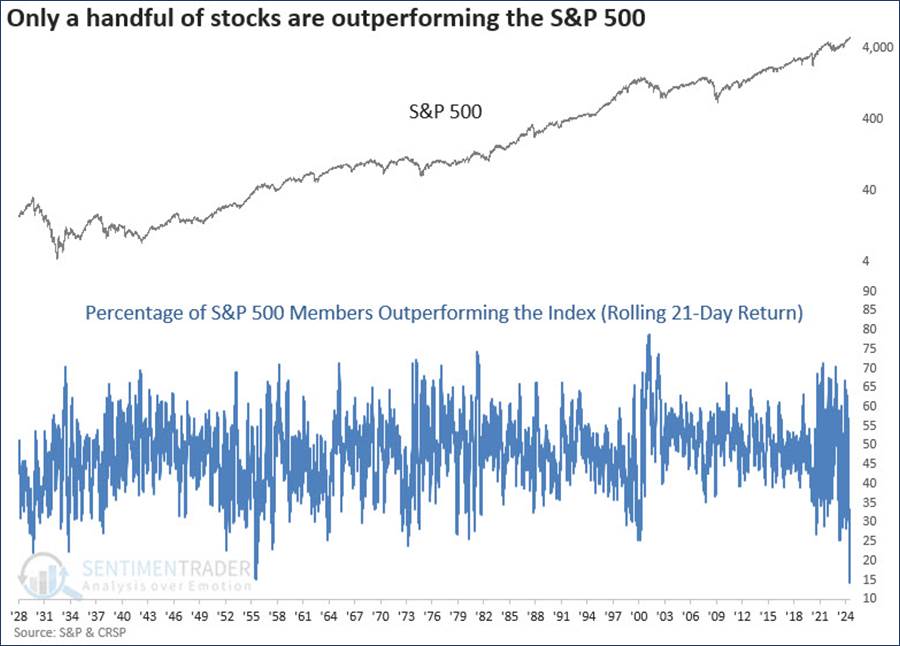
- We are on pace for the smallest percentage of stocks (less than one in four) outperforming the S&P than at any time in the last 50 years (see graph below).
- However, a strong first half has historically set the stage for good gains later in the year, too.
Part II: Q2 Recap – Jenga
Most readers have played Jenga at some point. For our family, it’s usually reserved for a rainy vacation day, or at pub trivia when the children’s interest has waned. It is likely none of us have the expertise to craft this:

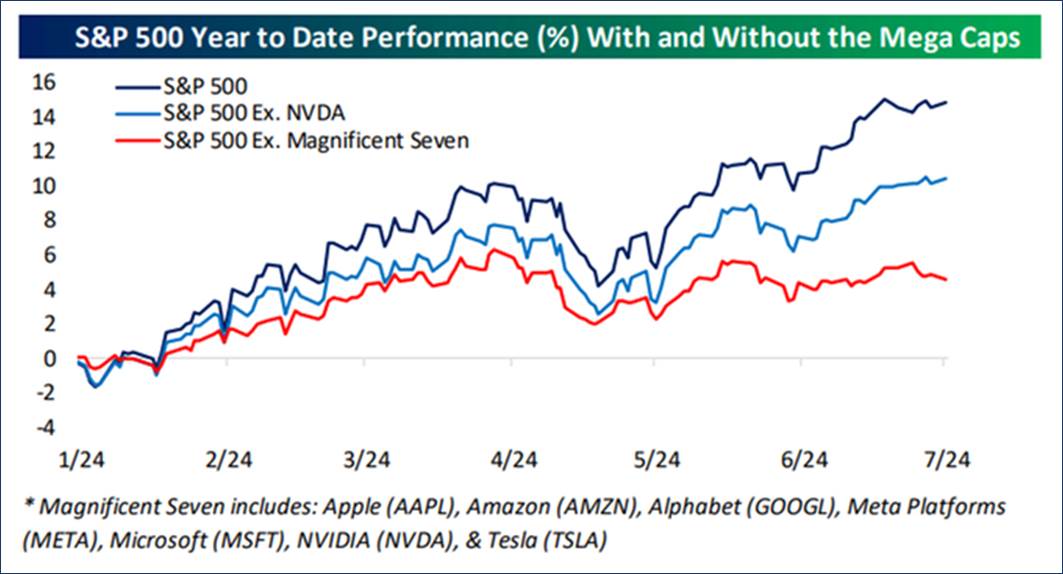
Whether you are looking at weights or contribution to performance, the S&P 500 looks a lot like this Jenga structure. That single block holding the entire structure aloft is Nvidia, which accounts for about 1/3 of the total YTD performance for the index. Rounding out the base are the other members of the Magnificent Seven, without which performance for the index is a mere 4%. The top 10 stocks account for 77% of index gains, the second most on record.
As of the end of June, the level of concentration in the top five names is as concentrated as it has been since the 1960s, a market structure we would define as inherently unstable.
Index returns are certainly reflective of this dispersion as well, with the cap-weighted indices like the S&P 500 and NASDAQ up over the last one- and three-month periods versus declines for the average stock, e.g., the S&P 500 Equal Weight.
| Fund/Index | 1-Month | 3-Month | YTD |
| S&P 500 INDEX | 3.59 | 4.28 | 15.29 |
| Invesco S&P 500 Equal Weight E | -0.51 | -2.62 | 4.96 |
| Russell 2000 Index | -0.93 | -3.28 | 1.73 |
| NASDAQ Composite Index | 6.03 | 8.47 | 18.57 |
| MSCI EAFE Index | -1.59 | -0.20 | 5.78 |
| MSCI Emerging Markets Index | 3.96 | 5.03 | 7.60 |
| Bloomberg US Treasury Total Re | 1.01 | 0.09 | -0.86 |
| Bloomberg US Agg Total Return | 0.95 | 0.07 | -0.71 |
| Invesco DB Commodity Index Tra | -0.17 | 1.13 | 5.40 |
Source: Bloomberg (as of most recent month end)
We are on pace for the smallest percentage of stocks (25%) to outperform the index in a calendar year since this data set began in the early 1970s; 2023 was the second smallest at 29%. In other words, the deck has been stacked against active managers like at no other time in history.
Other data sets show the percentage even lower (15%) and break records going back to the 1920s.
Q3 Outlook – Life
Much like real life, the game of Life involves a lot of skill as well as some luck, kind of like finding your first job, or investing. The top-down indicators we use as part of the skill set we built continue to indicate caution. While most factors have not moved, the most consequential shift we have seen is in GDP growth, specifically as it relates to employment. We will highlight this factor, but you can click here for the full recap on all factors.
| More Negative | Neutral | More Positive | |||
| Inflation | → | ||||
| GDP Growth | ← | ||||
| Fed Policy | ≈ | ||||
| Interest Rates | ≈ | ||||
| Credit Spreads | ≈ | ||||
| Stock Multiples | ≈ | ||||
| Earnings Growth | ≈ |
||||
| Deteriorating | ← | ||||
| Stable | ≈ | ||||
| Improving | → | ||||
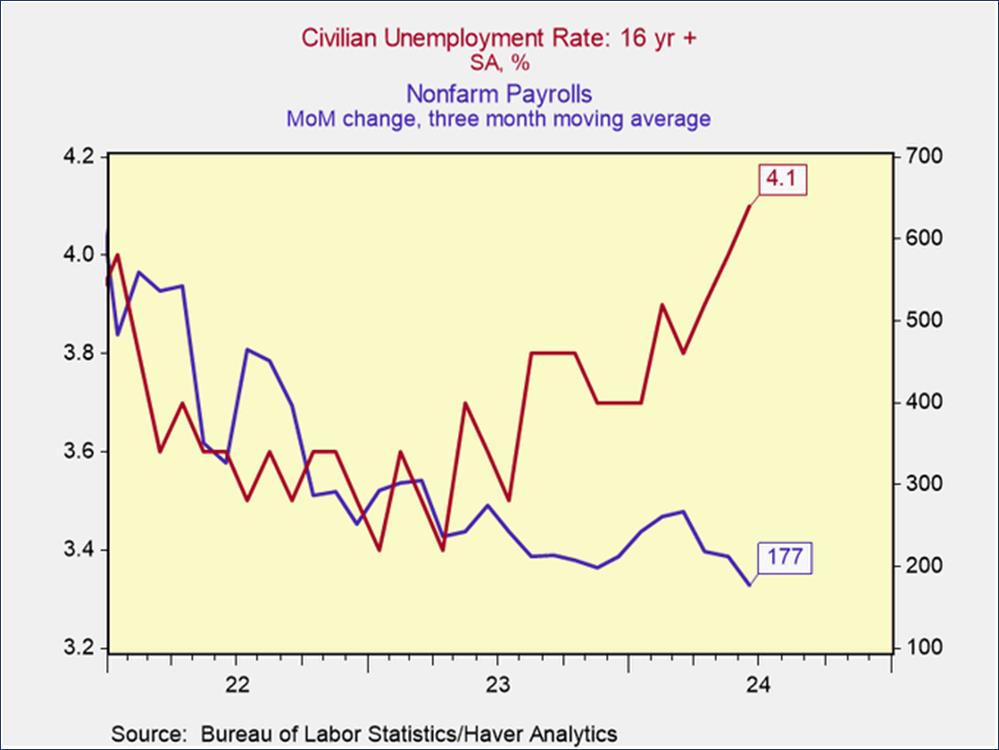
A key reason for deteriorating GDP growth is troubling data on the employment front. The sharp upward trajectory for the unemployment rate has triggered the Sahm rule; “This uptick triggers the Sahm Rule, a real-time recession indicator, suggesting that the US economy is in, or is nearing, a recession.” Given how anomalous conditions have been post-Covid, we are reticent to say a recession is a fait accompli, but the deterioration in the labor market is clearly concerning.
The team at RenMac, which has done an excellent job with its economic forecasts, is more resolute: “This is not a close call. The unemployment rate is climbing & payroll growth is slowing. Conditions in the labor market are cooling off. The trade-offs for the Fed have shifted. If they don’t cut this month, they ought to make a strong signal a cut is coming in September.”
Conclusion – Stratego
One of my favorite games as a child was Stratego. It was only through trial and error that you could discover where your opponent had hidden their bombs. Given that the current market run of avoiding 2% declines is currently the 11th longest in history, it has become easy for investors to forget that bad things can happen to equities. However, we are fortunate to have an engaged client base, and one of them recently shared this attention-grabbing headline, which is what you tend to see when volatility has disappeared: “Why the S&P 500 is poised to rocket 100% in 5 years”. Keys to this thesis were “Earnings might easily compound at 15% a year if the economy keeps chugging along and you get a little bit of multiple expansion, which I think lower interest rates would justify.”
Let’s look at those assumptions in turn. One, earnings compounding at 15% per year for an extended period is rare, not easy; over a five-year period, this would mean earnings double. Using data from NYU going back to 1960, the only period that saw five consecutive years of double-digit growth was 2002-2007, and that started from a low point, given the 2001 9/11-induced recession. Moreover, net profit margins started that period at around 6% and grew to 10% by 2007. Right now, we are at 12%, with the all-time peak for margins around 14%.
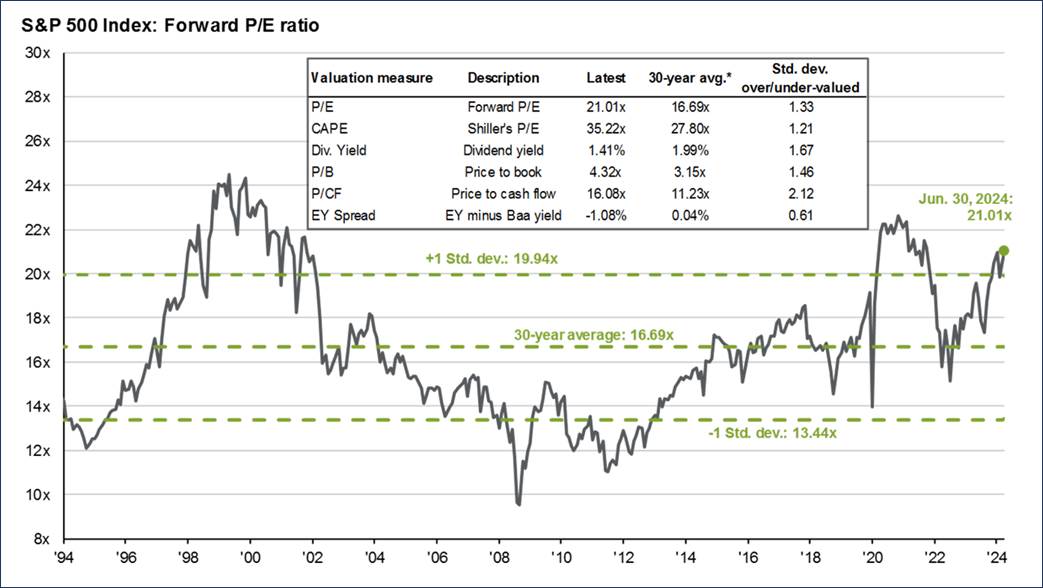
Two, in terms of valuation, justifying a higher multiple based on “lower interest rates” when, at 21x for the market as a whole, we are already well above the historical average, seems ambitious.
Does this mean we are doom and gloom? No. Statistically speaking, strong first half returns generally beget strong returns in the second half.
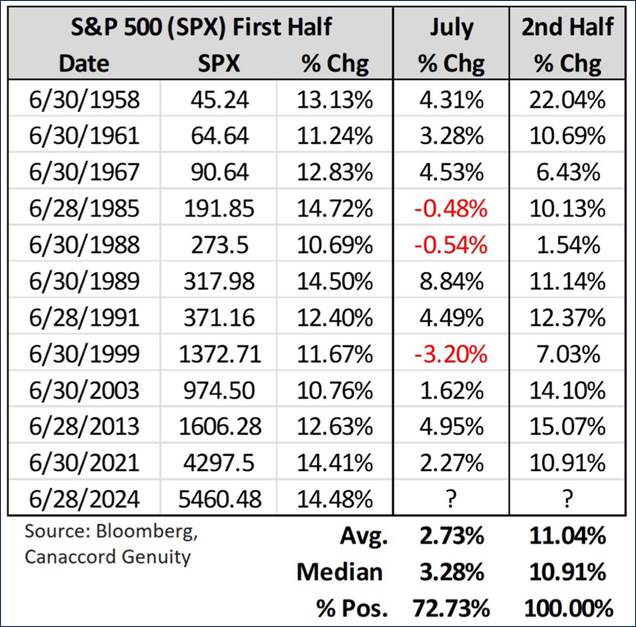
Having said that, the narrowness of the market does concern us. Will has tasked us with considering what it would take for the S&P to hit its average 2nd half return of 11%, based on the above table of occurrences of the S&P 500 gaining 10% in the 1st half of a given year.
If we had a normal market with broad participation, it would take earnings growth roughly in-line with expectations (around 12%; those stats are in the summary section) and no multiple compression (Fed eases up and we catch a break). Feasible? Sure.
Conversely, if the same narrow market we had in the 1st half persists, here is how the numbers break down:
- In the 1st half of this year, the top 10 accounted for 78% of the index’s performance.
- Nvidia alone accounted for 32% of the index’s H1 gain.
- An 11% gain for the 2nd half would represent the S&P 500 adding about $5.8 trillion to its market cap.
- 10 largest stocks would have the following traits:
- Comprise 44% of the index.
- Nvidia alone would be almost 10%.
- Have an average P/E of 37x.
- Nvidia would be 55x 2025 earnings.
- Gained 32% on average during 2H.
- Comprise 44% of the index.
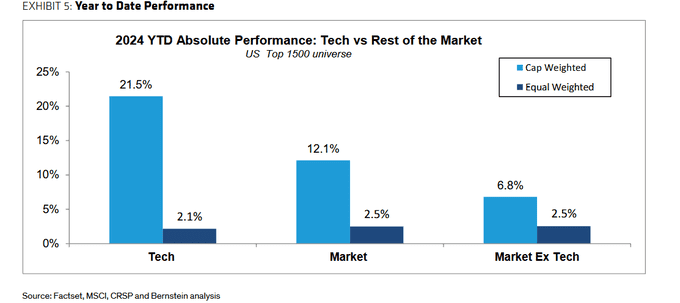
‘Can this continue?’ is the question we keep asking ourselves. 2023 (and the first half of 2024) have been all about a handful of the biggest technology stocks. The average technology stock is only up 2.1% this year, about in line with the average stock at 2.5%.
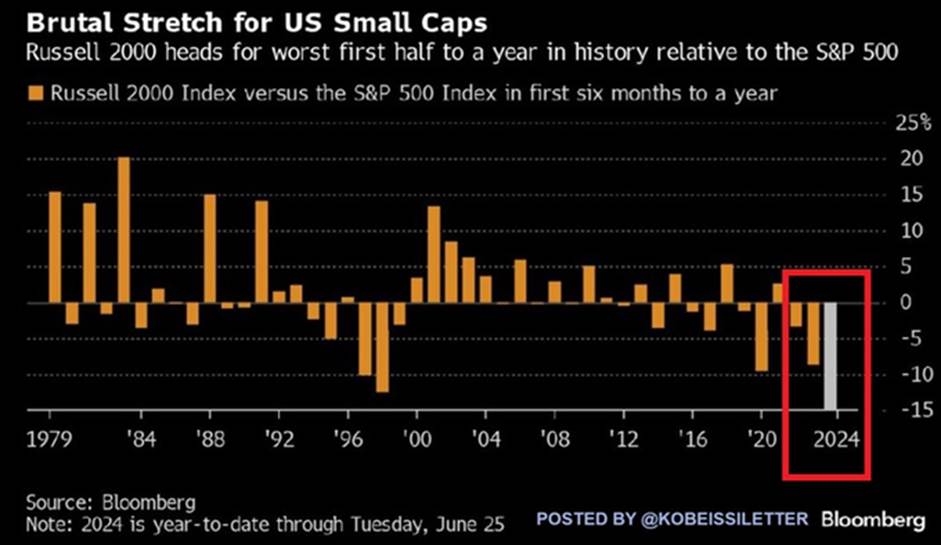
Conversely, small cap stocks, where we spend some of our time searching for value, have had the worst first half compared to large caps since the inception of the Russell 2000 Index in the 1970s.
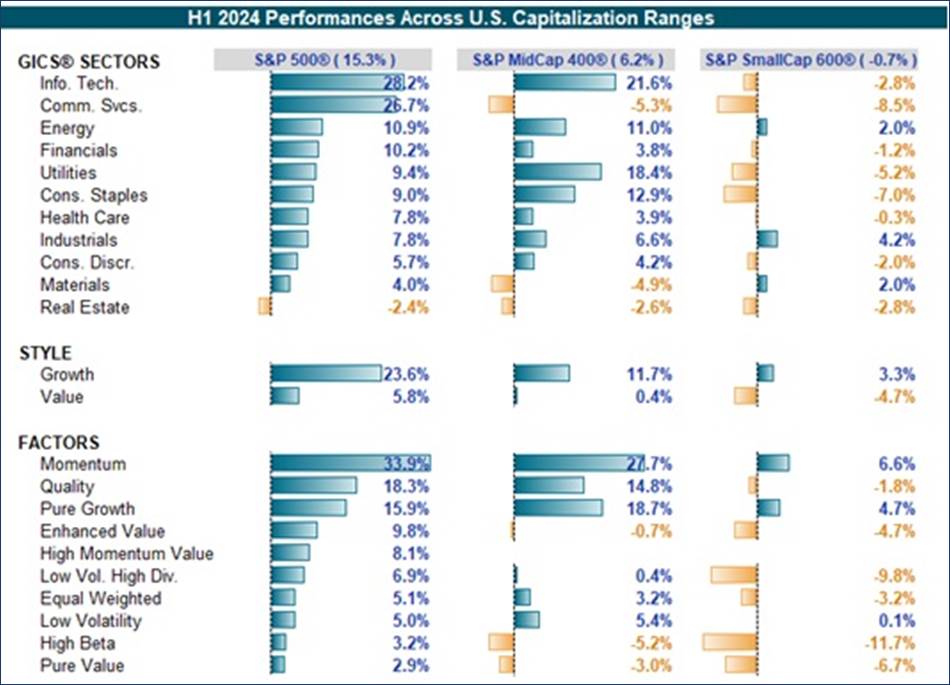
Whether it is sectors, size, or factors, the only things that have worked are:
- Two sectors (Tech and Communication Services – which is really just Facebook and Google)
- One style (Growth)
- Three factors (Momentum, Quality, and Growth)
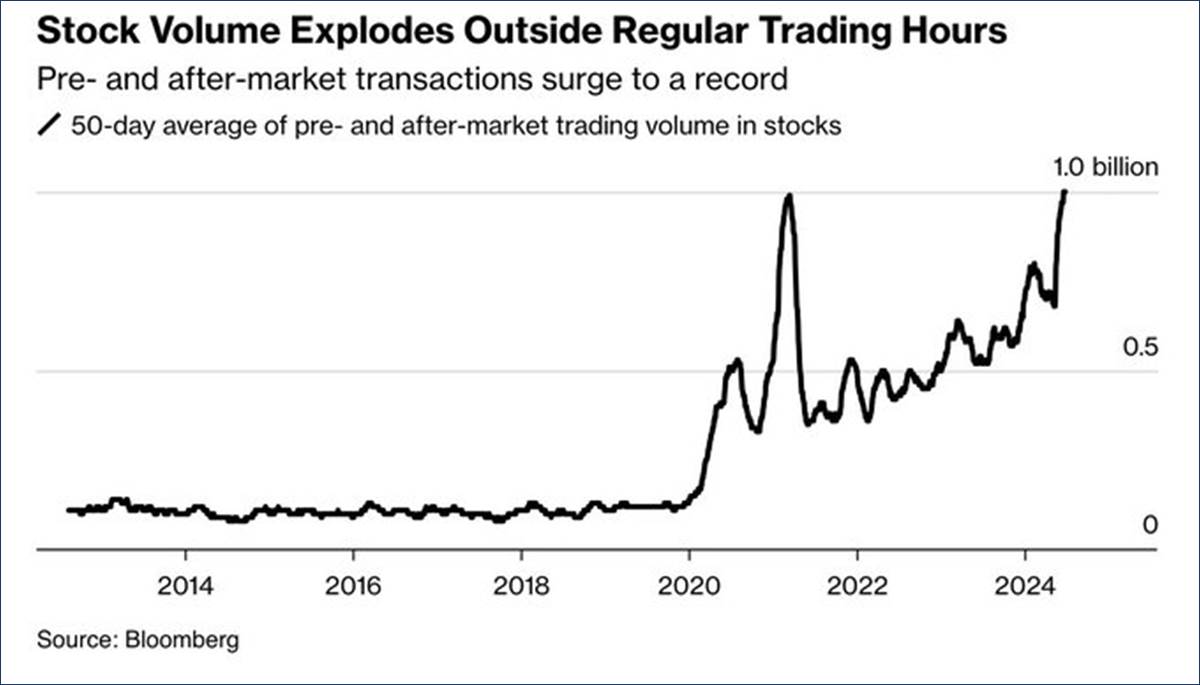
We have seen this movie previously. It reminds us of the Warren Buffett quote, “What the wise do in the beginning, fools do in the end.” Retail investors are piling in, using online platforms and after-hours trades like they did during the mania in 2021.
Similarly, Buffett’s preferred measure of market valuation has surpassed its 2021 high:
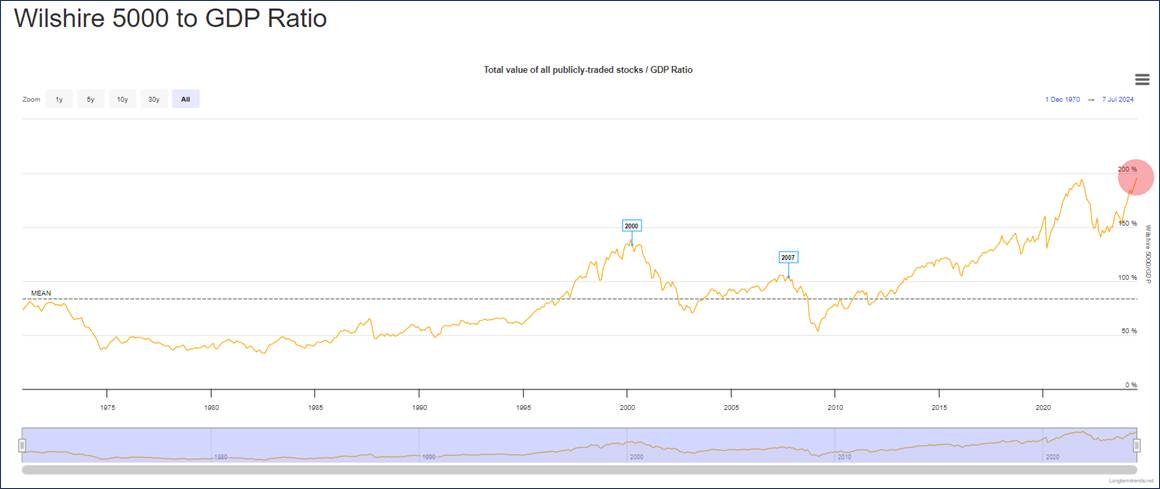
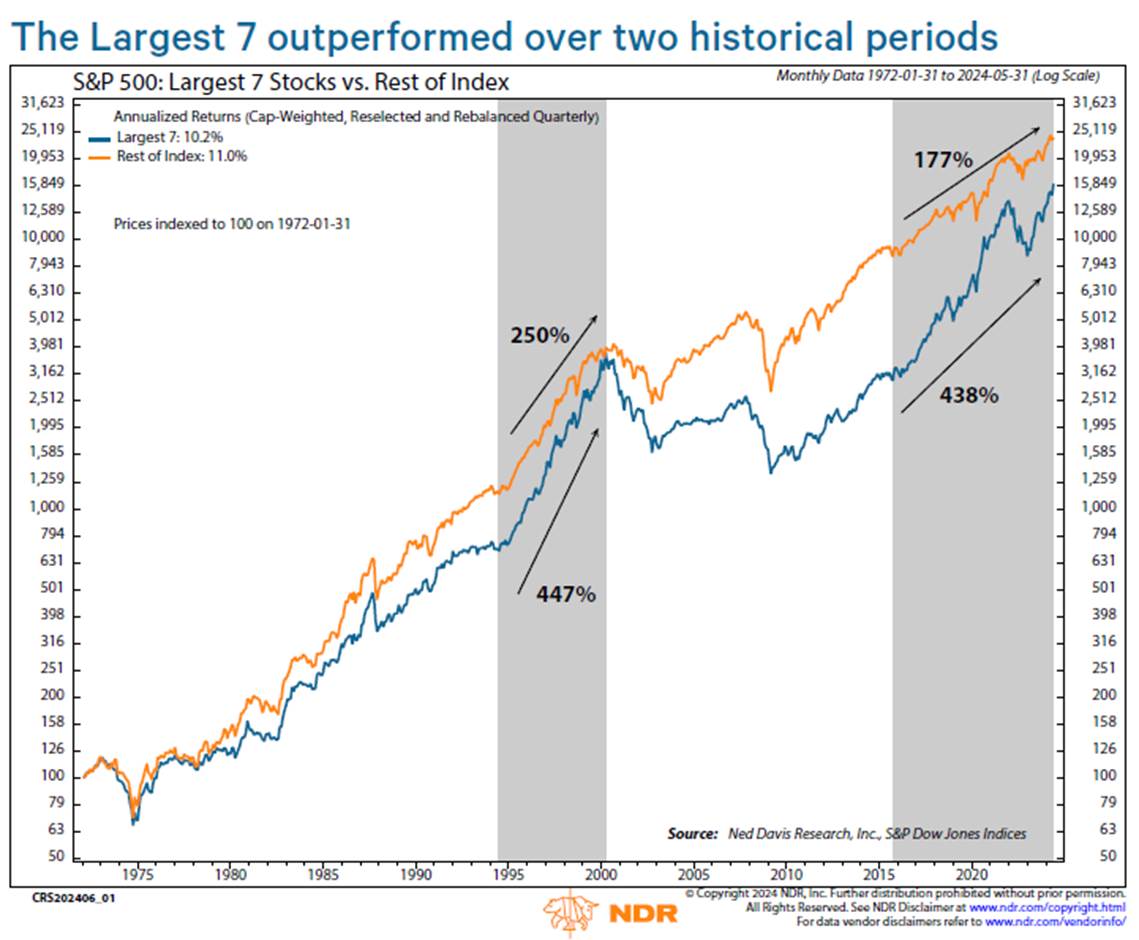
In an environment like this, our goal, as a fiduciary, is to make sure that our clients’ portfolios are positioned to participate if we get the type of strong second half that has historically followed a double-digit first half. If the market broadens, which is our hope, we would anticipate a much better participation in the rally versus a persistently narrow market, where our emphasis on managing risk generally precludes the outsized weights a so-called “diversified” index like the S&P 500 has at the top (Microsoft, Apple, Nvidia are all around 7% weights). The current run of the Magnificent Seven is approaching the magnitude (and has exceeded the duration) of the last time we saw a run like this. Once that run ended, a great era for active managers began, and we look forward to a similar normalization this time, which will provide for a more stable market.
Part III: In-depth analysis of Key Factors
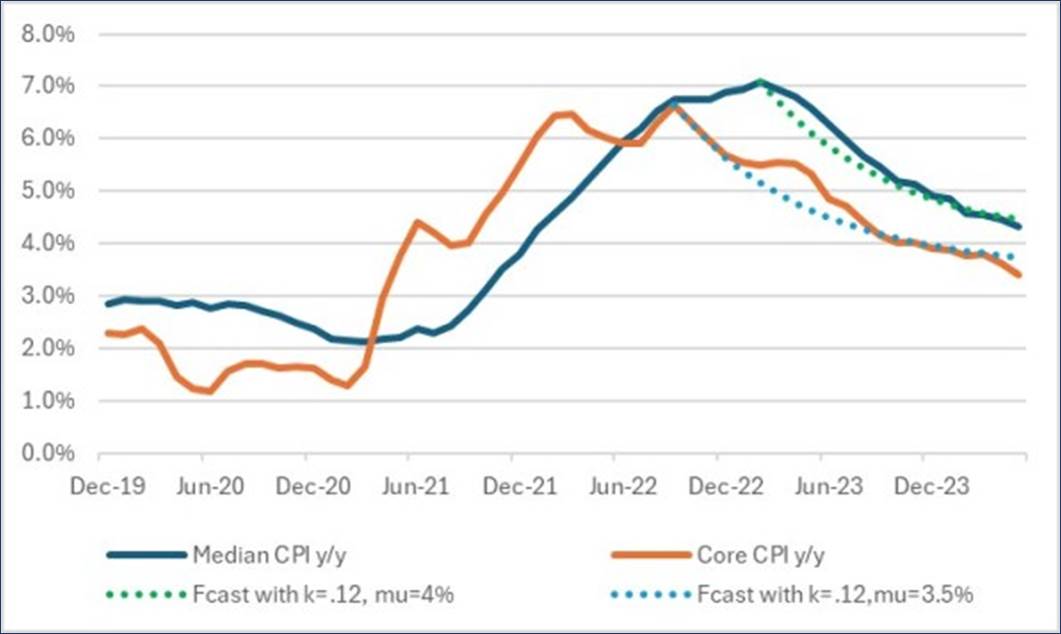
- Inflation – Negative but improving. After running hot in Q1, inflation cooled considerably in Q2. Even though Fed Chair Powell noted in early July the U.S was back on a “disinflationary path,” widely used inflation measures continue to run above the Fed’s stated long-term target of 2%.
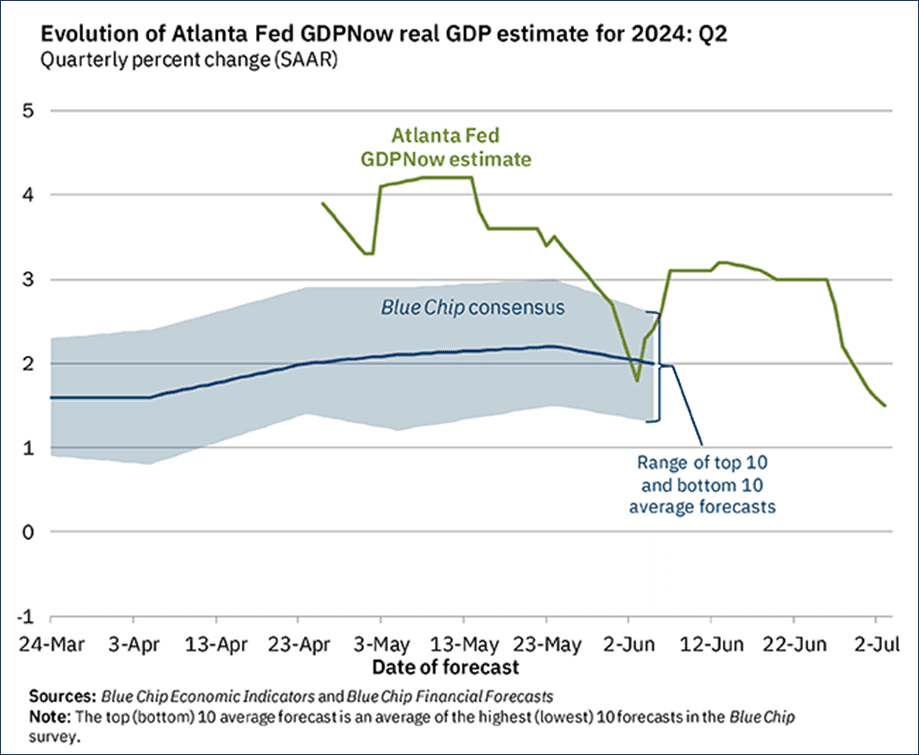
- GDP Growth – Positive but worsening. The Atlanta Fed’s volatile GDPNow estimate for Q2 has fallen sharply, though still shows the U.S. economy in expansion territory. However, projected growth has fallen from over 4% to a little over 1%, toward the bottom end of the range predicted by economists. As mentioned previously, waning employment data is a key factor.
- Fed Policy – Negative and stable. At a speech in Europe, Powell stated, “We want to be more confident that inflation is moving sustainably down toward 2% … before we start … loosening policy.”
Neither the odds nor timing of rate cuts moved a lot this quarter, with consensus remaining for two cuts this year, likely starting in September:
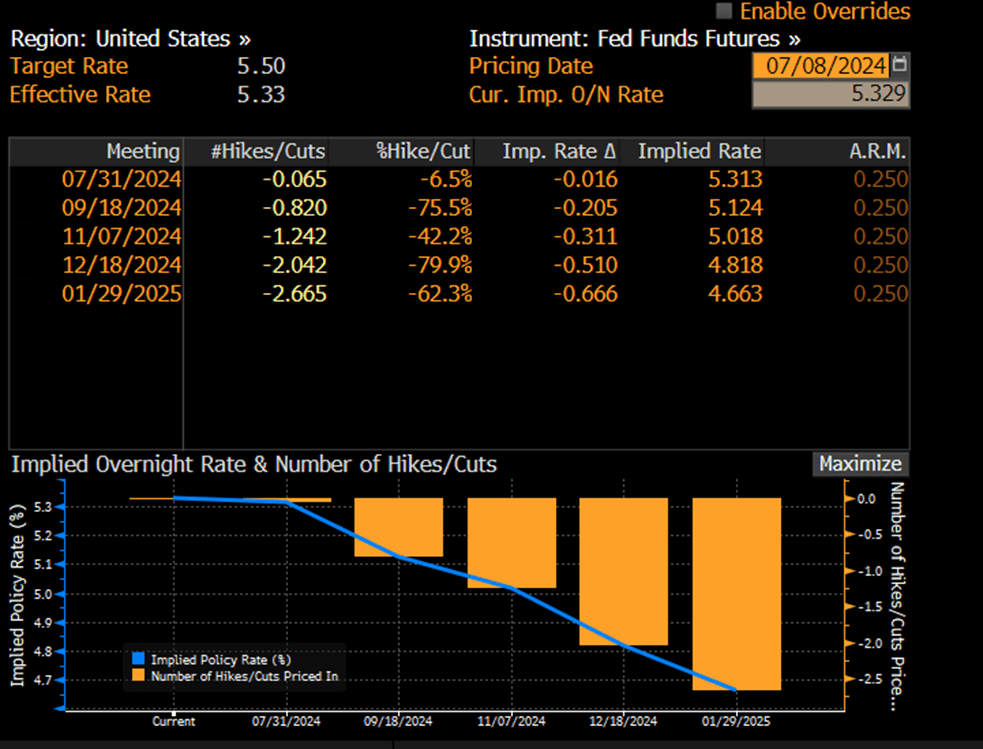
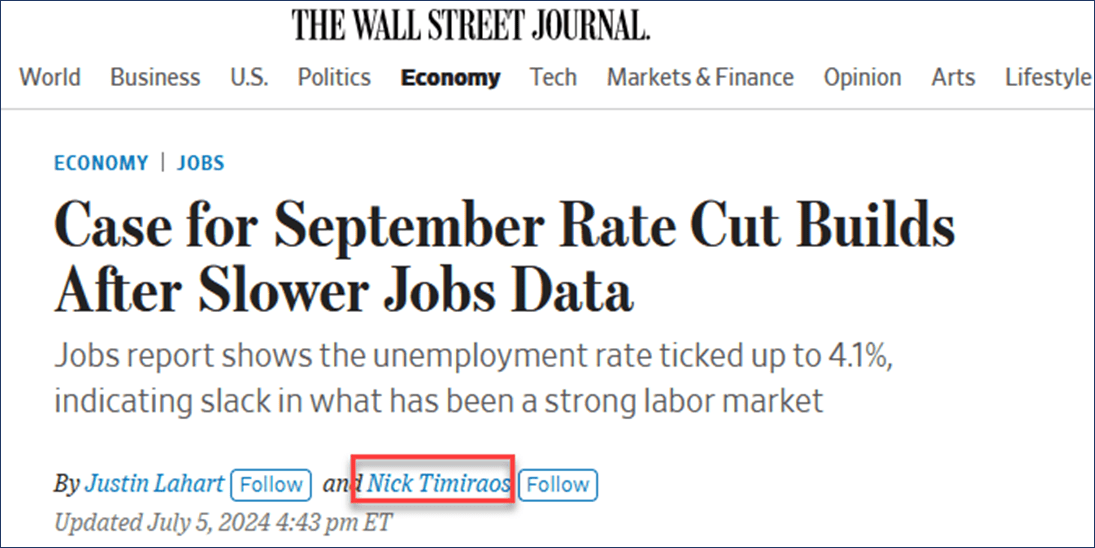
Nick Timiraos, who tends to float trial balloons for the Fed, co-authored this piece, providing a little more support for the theory that September is when cuts start:
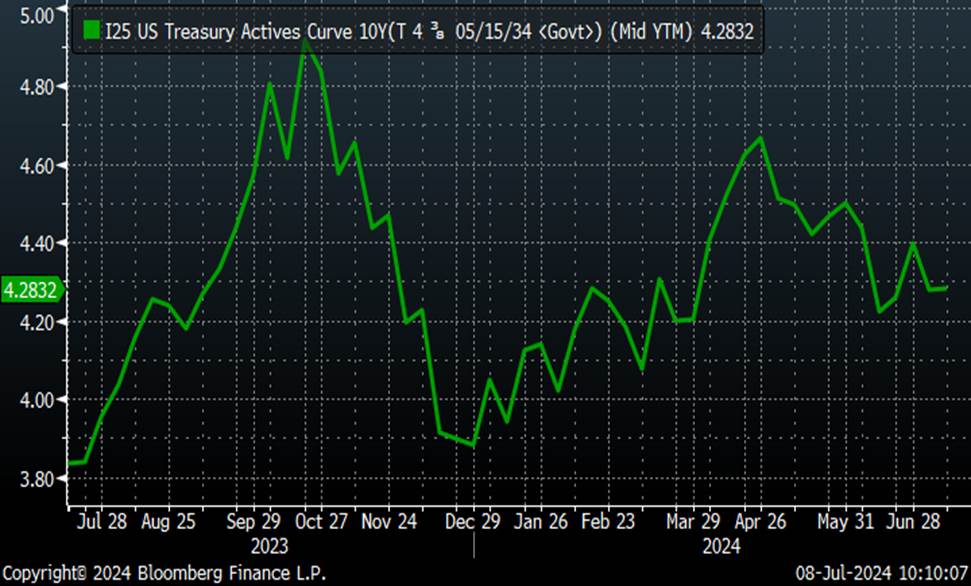
- Interest rates – Negative and worsening. The 10-year Treasury yield traded higher for most of the quarter, though is little changed from where it ended Q1. The 10-2 curve has now been inverted for over two years, leading many to call into question its efficacy as a recession portent.
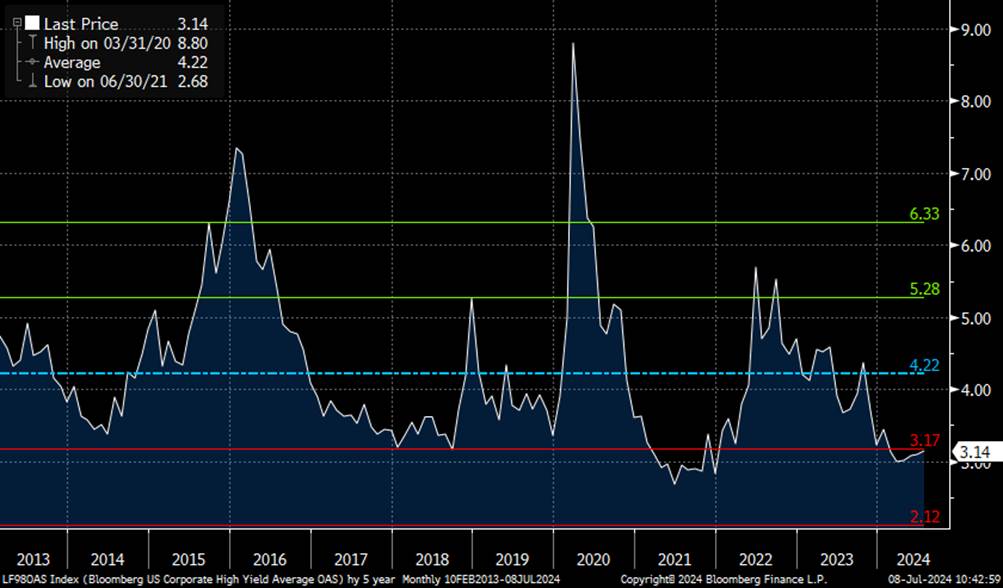
- Credit spreads – Negative and stable. A reminder we use this as a contrarian indicator. In other words, if we see spreads widening into the area above the green line, we may start to view risk/reward more favorably. High-yield spreads and investment grade spreads are tight, indicating no concern over the economy.
- Stock multiples – Negative but stable. Multiples expanded during Q2, though just slightly. However, for the S&P as a whole, P/Es for the largest names remain at levels only historically seen during periods of speculative mania.
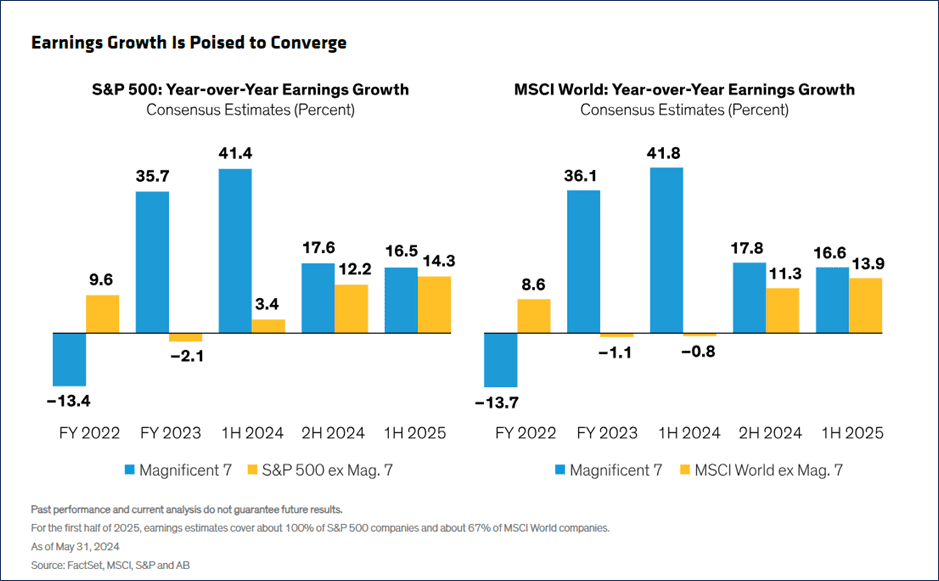
- Earnings growth – Negative but stable. Excluding the Magnificent Seven, earnings growth has been paltry. Expectations are incredibly high for both the Magnificent Seven and the other 493 for the rest of 2024 and in 2025. Can earnings growth remain this strong for the Mag 7, and accelerate this much for the other 493?
READY TO TALK?