January 2025 Update: Defying Gravity
Part I – Summary
We used a punny version of this on our recent podcast, “Defiling Gravity”, but we will look at the whole Wicked catalog for our January update (and 2024 recap).

Key Takeaways:
Popular
Defying Gravity
Thank Goodness
For those who prefer not to read further, before you close the email, please know these three things.
- 1For a second consecutive year, fewer than one in three stocks in the S&P 500 Index outperformed; the last time this occurred was 1998 and 1999, near the peak of the tech bubble.
- 2Valuations, while not quite as high as during the tech bubble, are highly elevated, especially at the top of the index.
- 3The last time we saw a similar environment, the stage was set for a multi-year run of outperformance by active management, value, and small/mid cap stocks.
Part II: Q4 AND 2024 Recap — Popular
“It’s all about popular, It’s not about aptitude, It’s the way you’re viewed, So it’s very shrewd to be, Very very popular.”
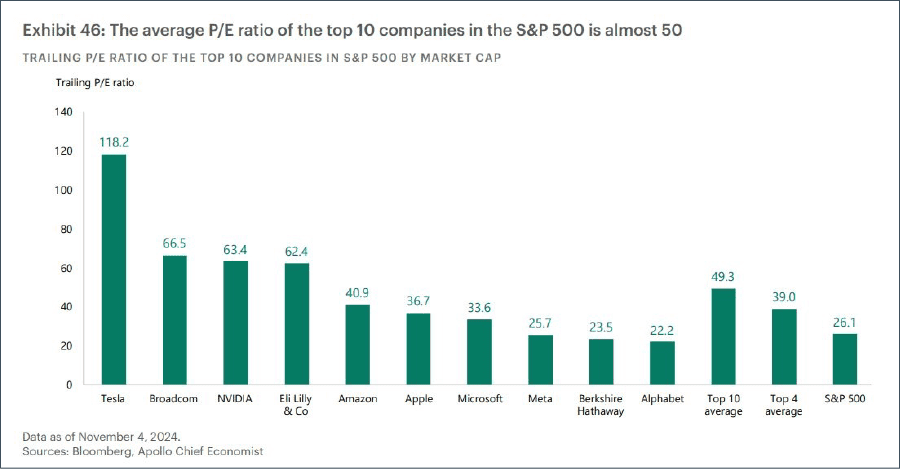
In 2024, stock investing was all about popular, with the biggest stocks viewed the most favorably, thanks in no small part to their perceived exposure to Artificial Intelligence. Granted, some did generate outstanding growth, but that was certainly reflected in valuation (and then some):
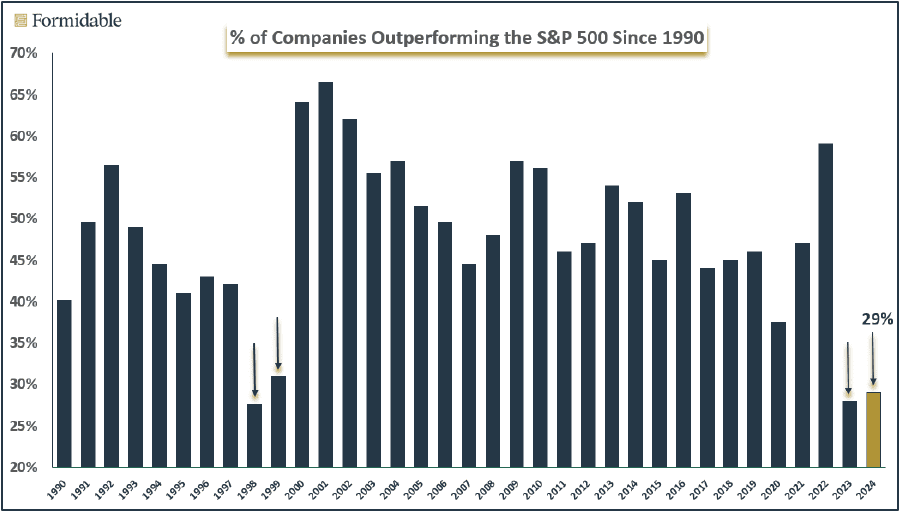
All stocks, especially small caps, posted strong gains after Trump’s November win. However, by the time the year concluded, megacap stocks led the index higher for a second consecutive year, with fewer than one in three stocks in the S&P 500 Index outperforming; the last time this occurred was 1998 and 1999, i.e., the summit of the tech bubble. Multiple expansion (in other words, popularity) accounted for about 50% of the gain for the entire index.
The S&P 500 outperformed the equal weight S&P, which reflects the “average” stock, by 12%. This was the second consecutive year of 12% outperformance; the only worse two-year run for the average stock was, once again, 1998 and 1999.
It was not just the S&P 500 crushing the average U.S. stock (as well as small caps) but non-U.S. stocks as well. The S&P 500 outperformed international stocks (MSCI EAFE) by over 20%, the largest gap since 1997:
| Fund/Index | 1-Month | 3-Month | 1-Year |
| S&P 500 INDEX | -2.39 | 2.39 | 25.00 |
| Invesco S&P 500 Equal Weight E | -6.28 | -1.85 | 12.78 |
| Russell 2000 Index | -8.26 | 0.33 | 11.53 |
| NASDAQ Composite Index | 0.56 | 6.36 | 29.60 |
| MSCI EAFE Index | -2.25 | -8.06 | 4.43 |
| MSCI Emerging Markets Index | -0.12 | -7.86 | 7.97 |
| Bloomberg US Treasury Total Re | -1.54 | -3.14 | 0.58 |
| Bloomberg US Agg Total Return | -1.64 | -3.06 | 1.25 |
| Invesco DB Commodity Index Tra | 1.72 | 1.12 | 2.18 |
At the sector level, we saw similar narrowness. Fewer than half of the sectors were outperformers, and, within sectors, it was often only a handful of companies that pushed returns. For example, 11.8% of the 12.2% Q4 return for the Consumer Discretionary sector were two stocks: Amazon and Tesla; the median stock in the sector lost 2%:
| Sector | 1-Month | 3-Month | 1-Year |
| Communication Services Select | -1.36 | 7.37 | 34.70 |
| Consumer Discretionary Select | 1.11 | 12.18 | 26.51 |
| Consumer Staples Select Sector | -4.82 | -4.57 | 12.19 |
| Energy Select Sector SPDR Fund | -9.58 | -1.62 | 5.52 |
| Financial Select Sector SPDR F | -5.46 | 7.10 | 30.55 |
| Health Care Select Sector SPDR | -6.26 | -10.28 | 2.47 |
| Industrial Select Sector SPDR | -8.03 | -2.23 | 17.31 |
| Materials Select Sector SPDR F | -10.76 | -12.24 | 0.14 |
| Real Estate Select Sector SPDR | -8.66 | -7.98 | 5.07 |
| Technology Select Sector SPDR | -0.36 | 3.16 | 21.63 |
| Utilities Select Sector SPDR F | -7.98 | -5.53 | 23.28 |
| S&P 500 INDEX | -2.39 | 2.39 | 25.00 |
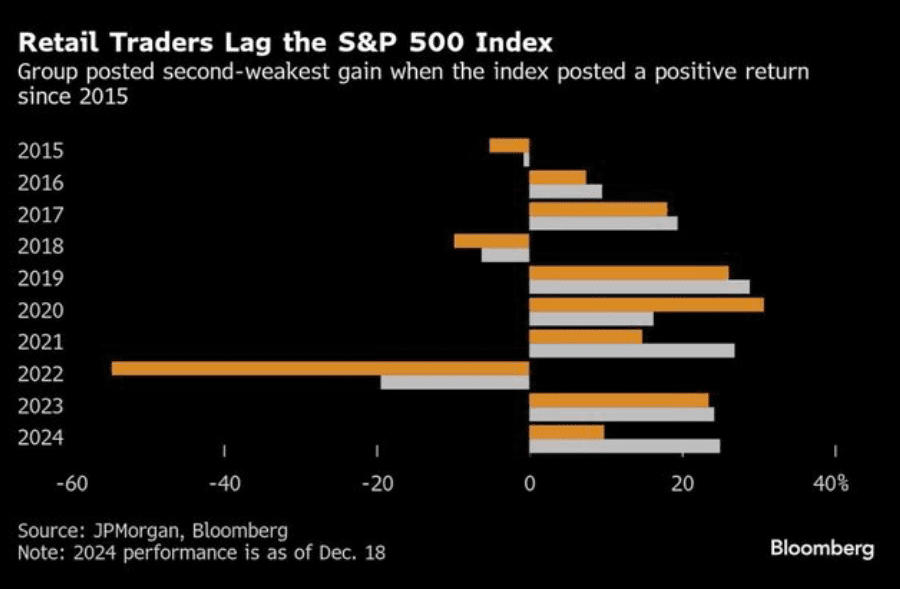
Despite some retail favorites, e.g., Nvidia, leading the S&P, retail investors on average lagged, only gaining around 10% in 2024.
Q1 and 2025 Outlook – Defying Gravity
“Can’t I make you understand, You’re having delusions of grandeur?, I’m through accepting limits, ‘Cause someone says they’re so.”
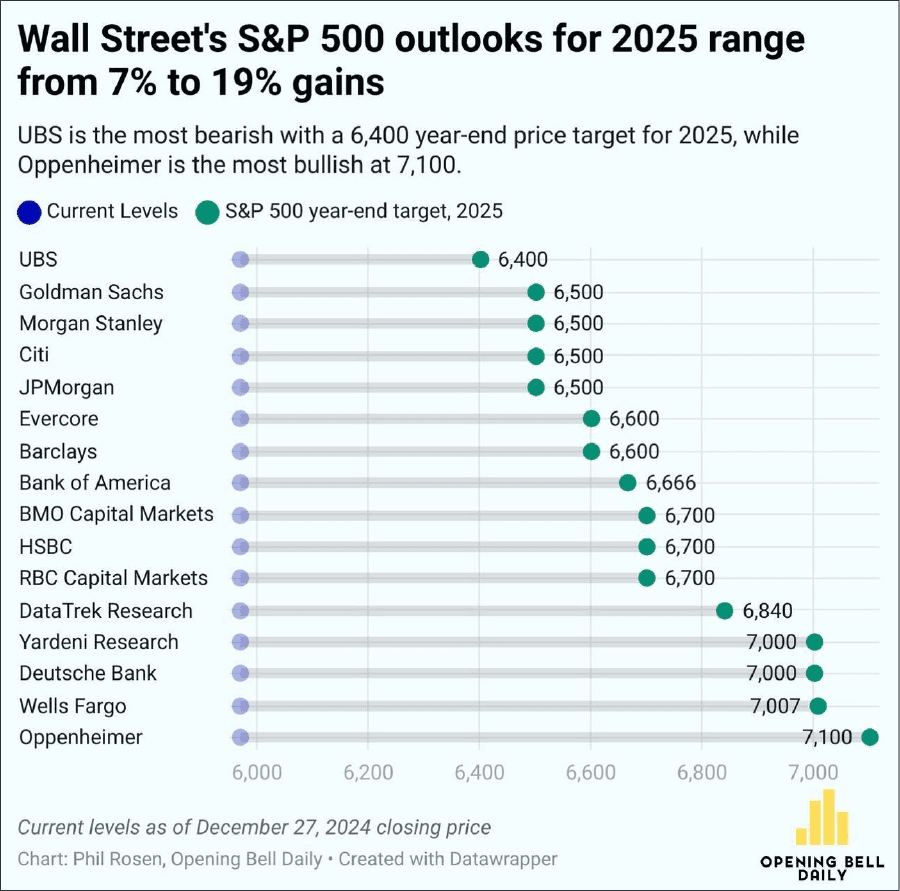
The first act of Wicked ends with Defying Gravity, which is, in large part, what Wall Street expects to happen in 2025. After undershooting by 21% on average in 2024, no one wants to be left behind again. However, according to Opening Bell, forecaster price targets miss by 14%, on average.
Two major factors tilted a little more negatively, especially as the Fed’s language shifted to more hawkish and the yield on the 10-year Treasury moved higher despite Fed rate cuts. Earnings growth looks more constructive as analysts are calling for broader participation by the other 493. For details, click here.
| More Negative | Neutral | More Positive | |||
| Inflation | ≈ | ||||
| GDP Growth | ≈ | ||||
| Fed Policy | ← | ||||
| Interest Rates | ← | ||||
| Credit Spreads | ≈ | ||||
| Stock Multiples | ≈ | ||||
| Earnings Growth | → | ||||
| Deteriorating | ← | ||||
| Status Quo | ≈ | ||||
| Improving | → | ||||
Are investors having delusions of grandeur? We think possibly, at least based on historical valuation norms:
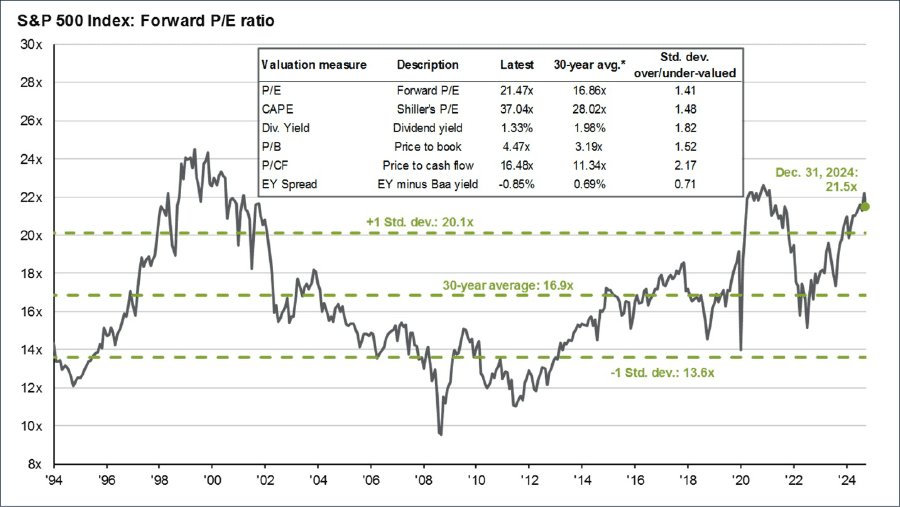
Much depends on the Great and Powerful Jerome Powell, and whether Fed rate cuts can bring down the 10-year yield, or if his powers are just as limited as those of Oz. Any move higher in rates has the potential to prove highly disruptive to these elevated valuations, not to mention the economy.
Conclusion – Thank Goodness
“There’s a kind of a sort of cost. There’s a couple of things get lost. There are bridges you cross, You didn’t know you crossed, Until you’ve crossed!”
Act II, or in the case of film, the sequel, kicks off with Thank Goodness. While we thank goodness for the strong returns of the past few years, the cost of these returns, driven in large part by multiple expansion, is that valuations are even more tilted against replicating these types of outsized gains.
Like Glinda, we won’t know we have crossed that bridge until we’ve crossed. However, both our quantitative framework and our decades of experience give us confidence that if we have not crossed it yet, we are close. While we have mentioned the similarities between now and the late 1990s, that bubble did not burst until March of 2000, and, as CNBC wrote on 2025’s first trading day, “Crypto trades jumping. Roaring Kitty boosting meme stocks. Broader market ripping on no apparent catalysts. Animal spirits are on the loose at the dawn of 2025 trading.”
However, what encourages us is that once the bridge was crossed, the setup was ideal for an extended run of outperformance for several things that are part of Formidable’s approach. One is active management. After 1999, the last time we saw back-to-back years like we have just experienced, it was a stock picker’s market for the next six years, and it was not just being down less in bear markets, but also winning once things turned. We have seen a few folks with even more gray hair than us liken this environment to the Nifty Fifty era (early 1970s), and there was a similar six-year run of outperformance subsequently.
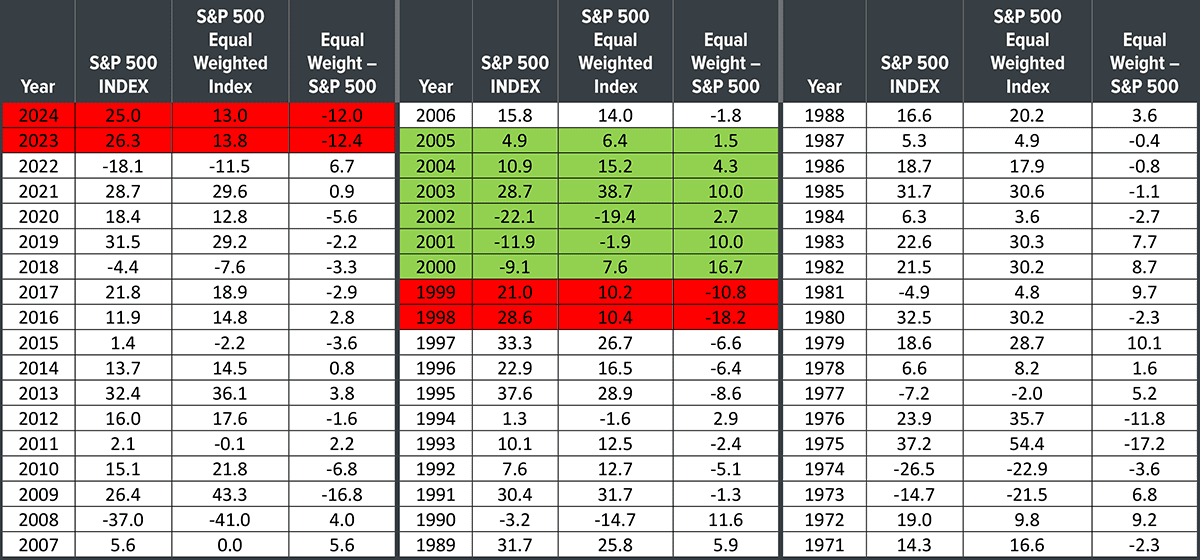
Similarly, this is the worst two-year run for value stocks since 1998/1999. That set up a run of seven consecutive years when value outperformed growth. It is the worst streak of underperformance for small cap stocks since 1997/1998; they went on to outperform each of the next six years.
We believe that the opportunities over the next few years are likely not on the yellow brick road of megacap stocks. Clearly some of these stocks have a place in an investor’s portfolio, though we contend that, for index investors, the 39% weight ten stocks have in the S&P 500 represents an outsized bet on the most expensive companies in the world.
Our hope is that the resilience of the U.S. economy, coupled with a presidential administration that is promising to be more business-friendly, allows for a continuation of the bull market, albeit one that is broader and led by less expensive, smaller and mid-size companies. We think there is a valuation case to be made for many of these companies, and with a less meddlesome regulatory environment, we could see a renewed wave of M&A activity provide an uplift to companies as the risk of the DoJ and FTC scuttling deals abates.
Conversely, if the risks we outlined become more pronounced, it is important to note that in a year like 2000, when the S&P 500 fell 9% as the tech bubble began to burst, the average stock was up almost 8%. Thank goodness for active management when things get tough.
Part III: In-depth analysis of Key Factors
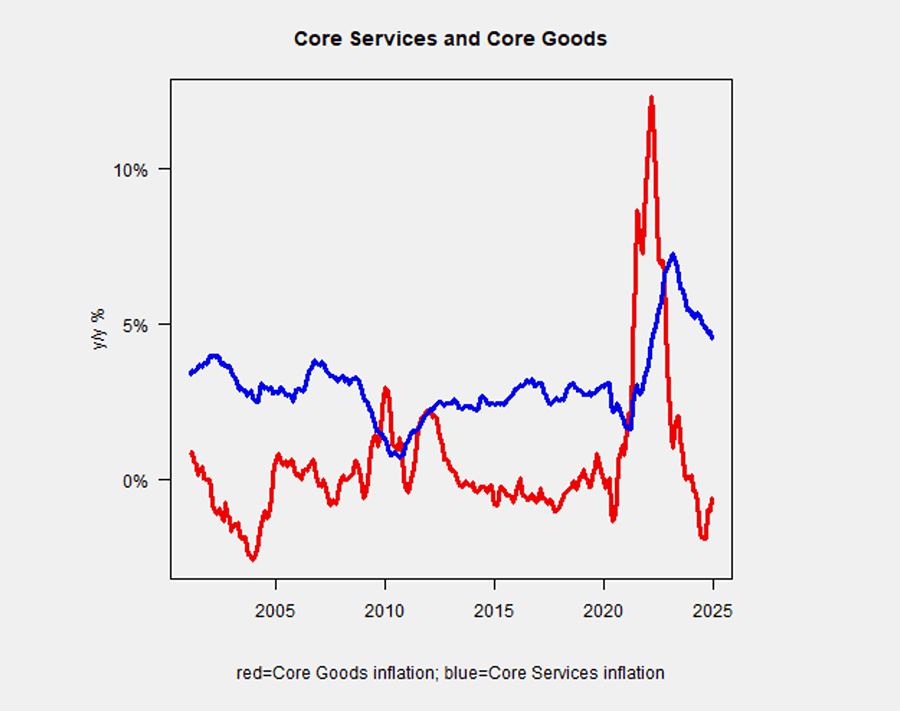
1. Inflation – Negative but stable. Fed Chair Powell was a touch less confident when he spoke at his December new conference, “I think that the lower—the slower pace of cuts for next year really reflects both the higher inflation readings we’ve had this year and the expectation that inflation will be higher. You saw in the SEP that risks and, and uncertainty around inflation we see as higher.”
While goods remain in deflationary mode, it is services, where housing costs reside, that remain stubbornly high:
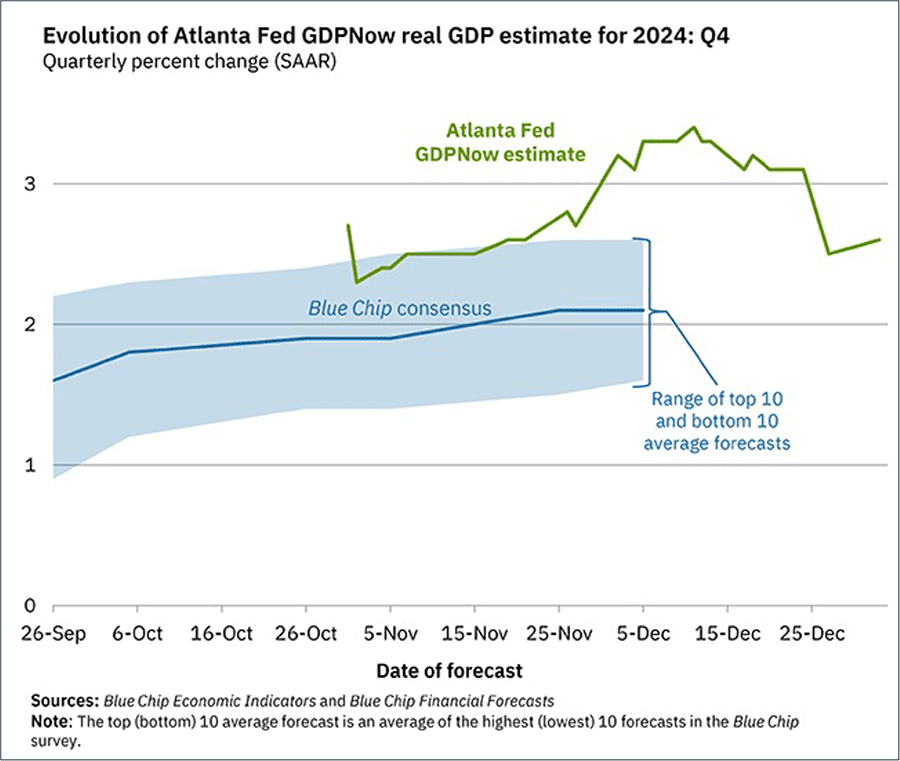
2. GDP Growth – Positive and stable. The Atlanta Fed’s volatile GDPNow estimate for Q4 has settled in the mid-2% range, which is clearly not recessionary, but also not scintillating, which was our exact sentiment last quarter. Job data has consistently been revised lower, which is worrying, as are some of the trends on delinquencies at the lower end of the wage spectrum.
3. Fed Policy – Negative and deteriorating. The Fed delivered a 25 basis-point cut at its December meeting, which was expected. However, as mentioned, Powell’s comments around inflation and the pace of rate cuts in 2025 were less encouraging, which is why we moved this into the deteriorating camp.
Odds are now that we get between one and two cuts in 2025 to end the year with a Fed Funds rate of around 3.9%. Three months ago, the market was pricing four to five cuts and a rate of 3% by the end of 2025.
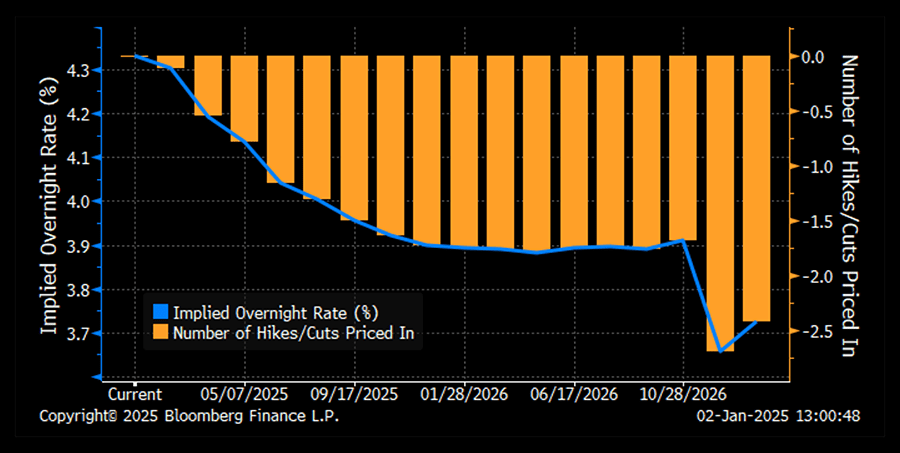
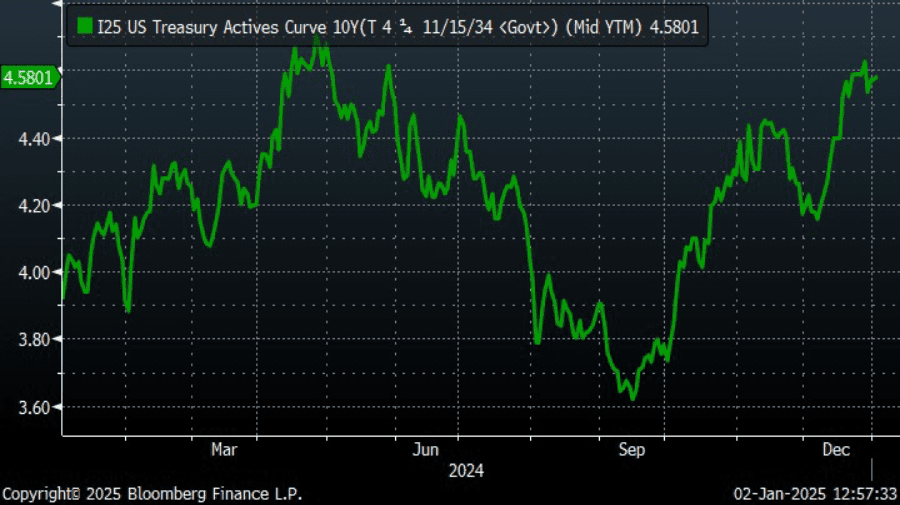
4. Interest rates – Negative and deteriorating. Probably the biggest story in financial markets no one is really discussing is the divergence between the Fed’s actions to lower short rates versus a sharp move higher in the benchmark 10-year Treasury. The move since the end of September, which coincided with the Fed’s first cut, has been sizable, and is having a significant impact on things like mortgage rates, which affects housing. The 10-year Treasury has not been this high at the end of a calendar year since 2006.
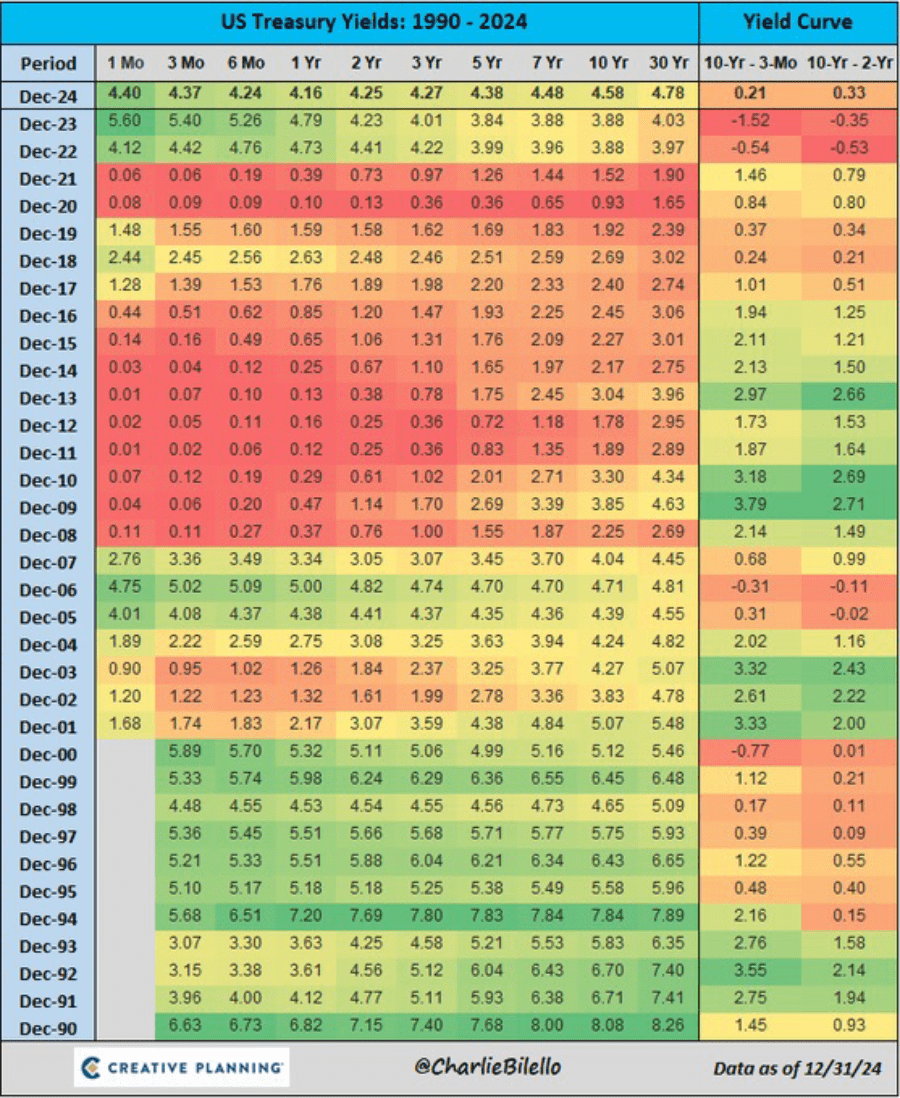
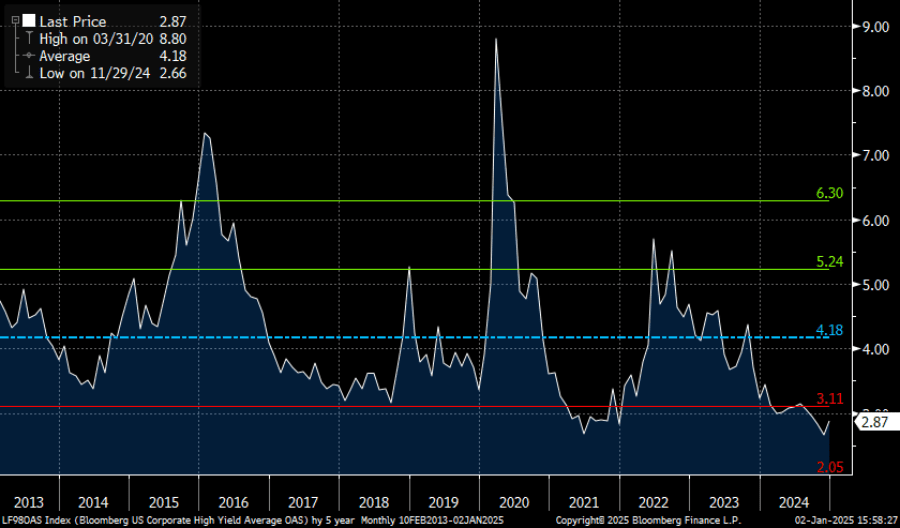
5. Credit spreads – Negative and stable. A reminder we use this as a contrarian indicator. In other words, if we see spreads widening into the area above the green line, we may start to view risk/reward more favorably. High-yield spreads and investment grade spreads are incredibly narrow, i.e., the market is paying little premium for credit risk.
6. Stock multiples – Negative and stable. Multiples were relatively stable for the S&P 500 in Q4, but remain elevated, especially for those companies at the top. Moreover, the Index has not had such a heavy weight in the top 10 since the Nifty Fifty era.
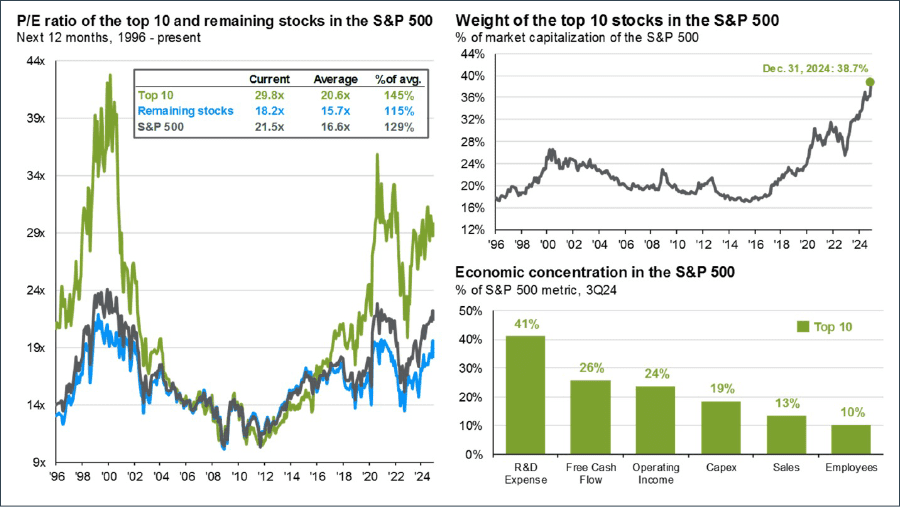
Source: J.P. Morgan
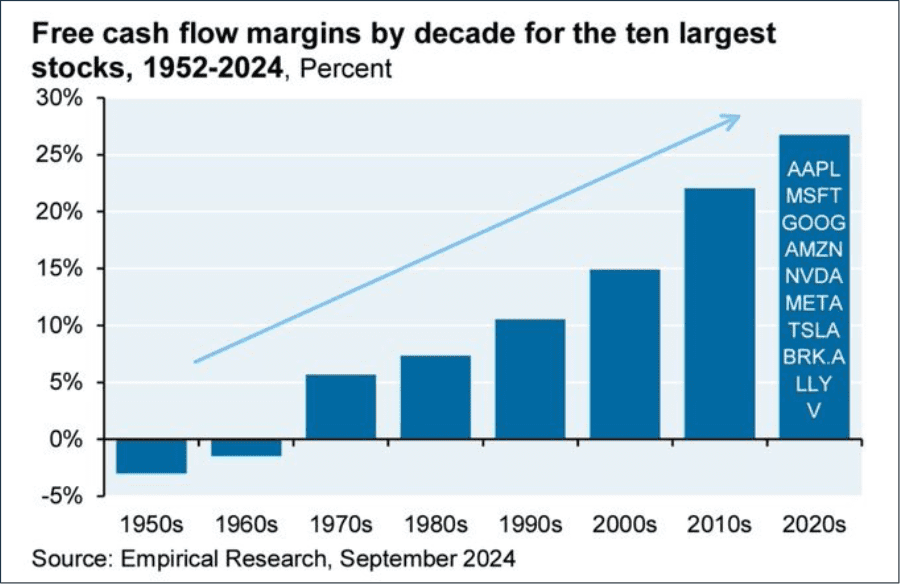
One can make the case that these businesses should be accorded higher valuations, based on their margins and earnings growth, but whether the size of the premium is justified remains a question in our assessment. We also question whether these margins are sustainable as what were capital-light businesses become increasingly capital intensive due to the AI arms race in which many are engaged.
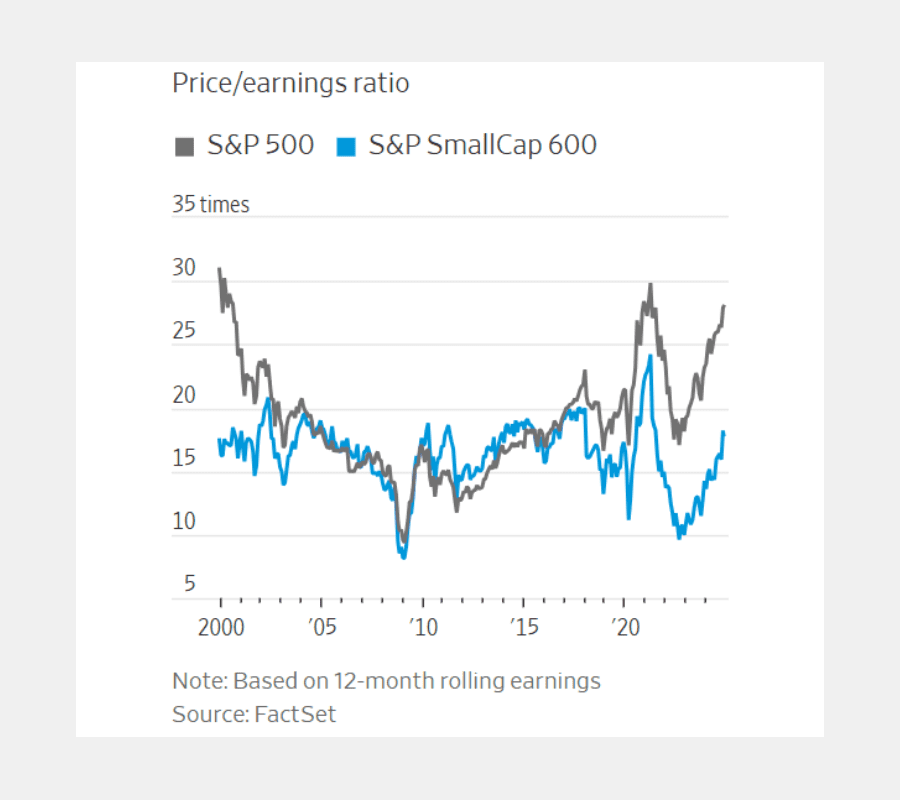
Meanwhile, higher quality small cap stocks remain well below their peak valuations.
7. Earnings growth – Improving and neutral. Excluding the Magnificent Seven, earnings growth has been paltry. Earnings expectations for the Magnificent Seven remain lofty (over 20%), while the other 493 are expected to turn the corner and post 13% growth for 2025, albeit back-end loaded. While this broadening is enough to tilt us into improving and neutral, the stage seems like it could be set for disappointment.
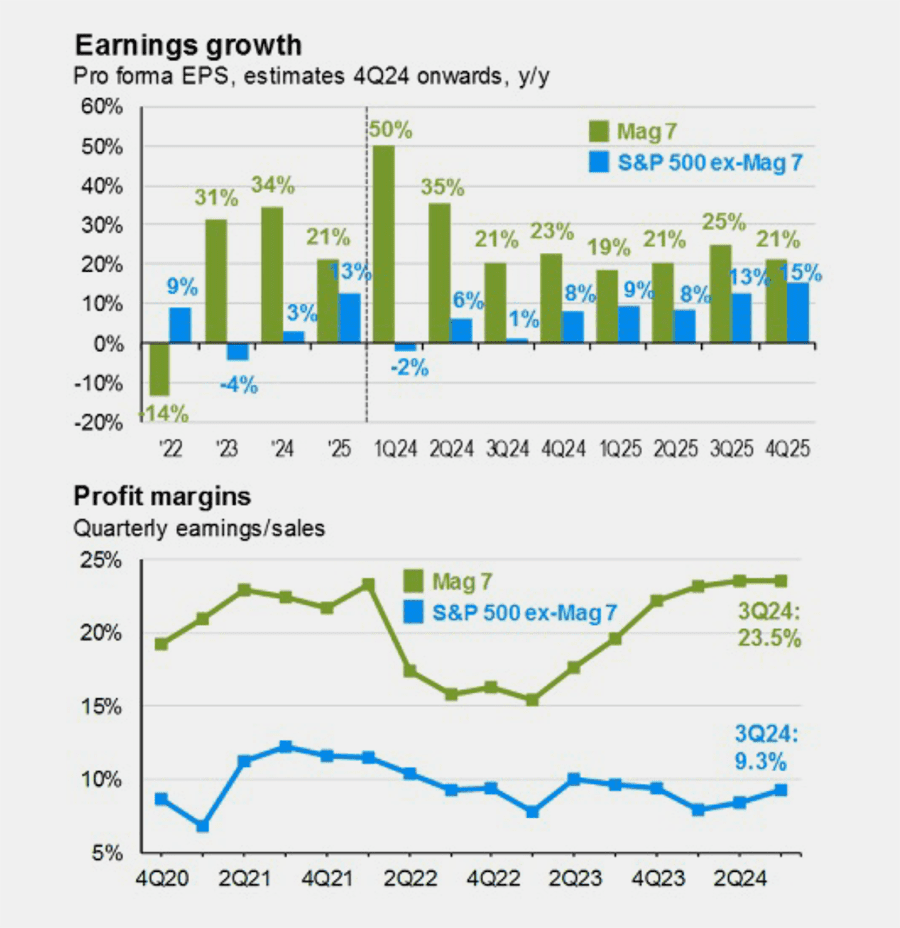
Source: J.P. Morgan
READY TO TALK?
