


Adam Eagleston, CFA
CIO
August 2024: Summer Update
Summer Update
As we reach the midpoint of summer, the only thing rising faster than the thermometer has been the VIX, a widely followed measure of market volatility. Since school is still out, we will keep this brief and focus on the five things clients are asking us:
- Why are stocks lower?
- Two main reasons.
- One, the U.S. economic data last week showed signs of weakness, especially on the labor front. The rise in unemployment triggered the Sahm rule, which has historically been a reliable recession indicator. However, the economist who created the rule, Julia Sahm, wrote in a Bloomberg article that this may not be the case this time.
- Two, and probably more importantly, the Bank of Japan modestly increased interest rates from zero. Without getting too technical, Japan’s currency, the yen, had fallen to multi-decade lows versus the dollar. Hedge funds had borrowed massive amounts in yen, given the low rates, as part of the so-called carry trade, and were surprised by the rate increase.
- Two main reasons.
- Why is volatility so high?
- Globally, it’s because markets have been incredibly volatile. For example, Japan’s market fell by 25% in less than a month (including over 12% this Monday), before bouncing 10% the next day.
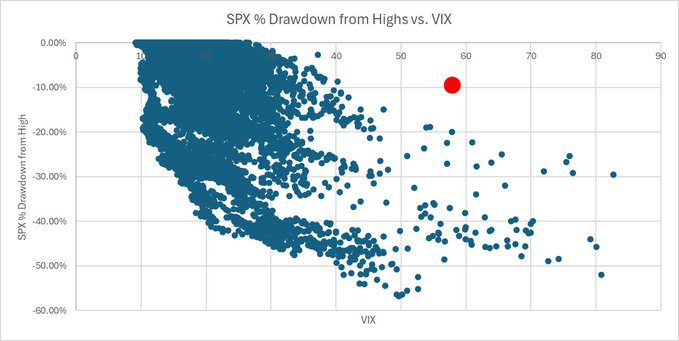
- Domestically, the VIX index, a widely used barometer for market fear, hit 65 on Monday. We have seen this level on the VIX on only two other occasions: the Covid selloff in February 2020 and the Global Financial Crisis. The level of fear was completely incongruent with an S&P 500 Index down only around 10% from its recent all-time high.
- Is this normal?
- On the volatility side, no. The red dot shows what an extreme outlier Monday was.
- However, a 10% decline is perfectly normal. Stocks experience a 10% decline, on average, about once every 12 months. And, since 1980, the average annual drawdown from the high for the S&P 500 is about 14%. Part of investing in stocks is the potential for declines, and what we have seen so far is in line, if not a little milder, than normal decline.
- Why does this feel worse?
- Probably because U.S. stocks had been so calm for so long. The S&P 500 went 356 trading days without a 2% decline before that streak ended on July 24. This was the longest stretch without a major daily decline since 2007.
- Also, for the first time in recent memory, the so-called Magnificent Seven stocks are lagging the Index. (These numbers were as of the close on August 7th):
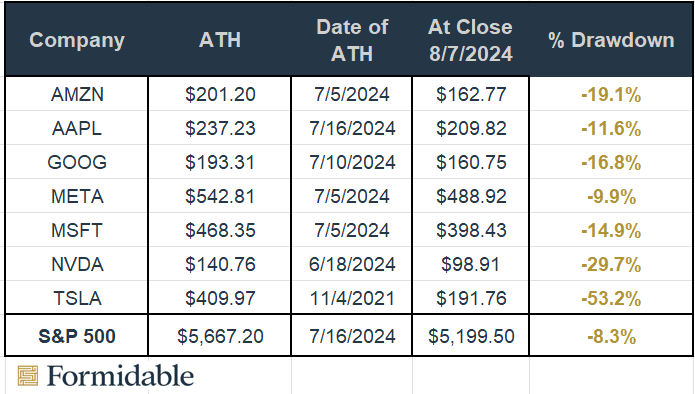
Source: FactSet
- What’s next?
- One of the more insightful traders we follow describes VIX as a temperature gauge versus a fear gauge. When people have a dangerously high fever, they normally don’t get better overnight; markets are usually the same.
- This Bloomberg article compares the events of the last week to a tectonic shift, where we won’t know the full effect for some time. The subsequent tsunamis (if any) may not appear for weeks.
- Longview Economics looked at 15 S&P 500 selloffs since 1978 when an initial wave of selling brought the index down by at least 10% (which happened Monday intraday).
- In 13 of 15 examples, retest of low occurred in a subsequent wave of selling (i.e., after relief rally).
- The two exceptions were April 2012 and October 1997.
- Coincidentally, we were vacationing in a tsunami hazard zone last week. The advice on the sign: go to high ground or inland. Our advice from a market perspective: go to high quality and stay diversified. Talk with your financial advisor and remain focused on the long-term. Once volatility arrives, it often doesn’t recede quickly, and we continue to see large moves in both stocks and bonds.
- Longview Economics looked at 15 S&P 500 selloffs since 1978 when an initial wave of selling brought the index down by at least 10% (which happened Monday intraday).

Source: Eagleston Family Archives
READY TO TALK?