Market Commentary December, 2020
November Update: Action Park
With recent news that Warner Brothers is releasing its 2021 slate to HBO Max concurrent with each film’s theatrical release, it seems timely to consider risk as it relates to a documentary from the newly powerful streaming service.
The film: Class Action Park, demonstrates the sometimes-tragic consequences of not properly evaluating risk. . Located in New Jersey (everything is legal in New Jersey, per Hamilton), the park was the vision of a Wall Street veteran, Gene Mulvihill, whose firm was suspended by the SEC for fraud. He used his, shall we say, creative energy to develop an amusement park almost completely devoid of anything resembling safety, reason, common sense, or consideration of the laws of physics. The stakes are somewhat lower; i.e. no lives lost, but some of the market behavior we saw in November could be described similarly. It’s cliché, but investing is often described as being similar to riding a roller coaster—but lately, it’s seemingly more like visiting an illogically conceived, exceeding dangerous theme park.
Cannonball Loop
From the book on the park written by Mulvihill’s son, Andy, this ride is best illustrated as follows: “even if he were on all the drugs in the world, Hunter S. Thompson would not go down the Cannonball Loop.” One look at picture and you can see why:

As we think back to late October, investors were equally as reticent to jump into the market with gusto. There was election uncertainty, no vaccine news, increasing case counts, the list continues.
Now, a month later, we have exited the loop, and everything is seen as smooth sailing. Despite rumblings over voter fraud, the tumult many feared has not materialized, at least yet. News on the vaccine front has been fast and furious, though some concerns remain (rollout, side effects, etc.) There are other exciting developments on the COVID-fighting front with a company we know well, Imbed Biosciences, which has developed a promising silver nanotechnology treatment.
Case counts globally have plateaued (though domestically we are not out of the post-Thanksgiving spike woods).
Not to get too technical, but November’s combination of positive return (over 10% for the S&P 500) and collapse in volatility (down over 60% as measured by the VIX) was unprecedented, as we see in Graph One, which was assembled by Lawrence Hamtil, one of Twitter’s hidden gems from a market analysis perspective. Pretty much the only investors extracting their teeth from the loop were those bearish investors long volatility entering the month.
Graph One

Tarzan Swing
The name of the ride was self-explanatory, the execution where the magic was: swing over the water and drop into an ice-cold stream while being heckled by drunken patrons. Investors can sympathize with this type of shock to the system as we saw quite the swing in November, with prior laggards leading the markets in November:
Table One
| Index | 1-Month | 3-Month | YTD | 1-Year |
| S&P 500 INDEX | 10.95 | 3.89 | 14.01 | 17.44 |
| NASDAQ Composite Index | 11.91 | 3.80 | 37.17 | 42.17 |
| Russell 2000 Index | 18.42 | 16.86 | 10.39 | 13.57 |
| MSCI EAFE Index | 15.51 | 8.09 | 3.54 | 6.93 |
| MSCI Emerging Markets Index | 9.25 | 9.75 | 10.49 | 18.79 |
| Bloomberg Barclays US Agg | 0.98 | 0.48 | 7.36 | 7.28 |
| Bloomberg Barclays US Treasury | 0.35 | -0.46 | 8.25 | 7.64 |
Source: Bloomberg
The monthly return for small caps, as measured by the Russell 2000, was the best on record for the index, bringing its YTD return into double-digits. The market term for what we saw in November was massive rotation; this graph from Raymond James shows what we mean; the worst performers over the trailing twelve months (right) were among the best for November (left), whereas the former leaders were positive, just not by much. While not mentioned, November was the first time in recent memory that value, i.e., cheap, stocks, outperformed growth stocks (we alluded to the underperformance of value last month).
Graph Two

However, year-to-date, it has been a different story. The 10% of large cap stocks with the highest multiples, i.e., the most expensive, have outperformed those with the lowest multiples by 91%. This is staggering, and it bears repeating, highlighting, and putting in bold, so here you go: 91%.
What else has won? Stocks that “smart investors” hate, i.e., those they bet will decline in price. Historically, trading against short sellers (those who bet on declines for stocks they deem overvalued, fraudulent, etc.) has been a loser’s game. However, the losers this year have been the short sellers, as the most shorted names have more than doubled.
Graph Three

Before we leave the Tarzan Swing, let us not forget that rates have plunged this year. However, we have recently started to see a snap back, which serves as a warning shot for fixed income investors. Returns were paltry in November, and Treasuries have lost ground over the last three months. Rates on the ten-year U.S. Treasury have bumped the 1% level a few times. A sustained break above that psychologically important line may prove problematic, given that bond prices are mathematical.
Here is the last year and, for comparison, all time (well, 1962,when the Fed started its data set). A move to pre-COVID levels would represent about a 1% rise in rates:

Graph Five

Tidal Wave Pool
Even the wave pool at Action Park was dangerous, probably because too many people piled in at the same time. With major U.S. indices at all-time highs, we are seeing this type of behavior among investors as well, which is best illustrated through a few graphs.
First, ETF flows for November: a new monthly record:
Table Two

Next, hedge funds at year-to-date highs for gross and net exposure:
Graph Six

Yields on junk bonds, i.e., how much riskier companies must pay to borrow, at all-time lows:
Graph Seven

Last, and most disturbingly, record call option buying, and by record, we mean ever:
Graph Eight

Briefly, the reason for the admonition over call buying is twofold. One, there is massive buying by retail investors speculating in individual names using short-dated calls. Two, unlike a stock, an option has an expiration date. Without getting too technical, sellers of options, typically institutions, hedge their positions by buying the underlying stock against which they sold the option. To maintain their exposure, the call option buyer must re-up, i.e., buy a call again. Failure to do so leads the seller to unwind their hedge, putting selling pressure on the underlying stock. In other words, it requires continued call option buying to keep a stock afloat, somewhat like a shark that must keep swimming forward to survive (sadly, or thankfully, Action Park’s Water World was shark free, though probably not for lack of trying).
Egress
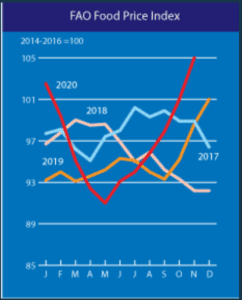
There is an old story that P.T. Barnum used the word egress instead of exit to trick people into leaving his museum, allowing room for new paying patrons. May have been one of the few tricks Action Park did not use. This clever word play reminds us of the government’s definition of inflation. While officials may proclaim it contained (just across the newswire: Kashkari: Not seeing evidence of high inflation around corner), it does not feel that way; one of the reasons is food price inflation, which we all witness firsthand:
Graph Nine

We are also seeing inflation in things like base metals (think copper and iron ore); theoretically, this will pass through to other goods.
If, and it is a big if, the combination of relaxed monetary policy and fiscal stimulus triggers broad-based inflation, we could face problems. Interest rates would likely rise (bad for bonds; again, this is mathematical) unless the Fed buys a lot of bonds (bad for the dollar, which is already struggling).
Graph Ten

The high valuations for U.S. stocks are rationalized based on low interest rates. None other than Robert Shiller, inventor of the CAPE ratio, which adjusts valuations based on cyclical factors, recently stated this to be the case. The CAPE ratio has only been higher two other times: in the early 2000s and late 1920s.
The S&P 500 is certainly expensive, relative to prior recoveries:
Graph Eleven

Where most investors get things wrong, especially now, when over 50% of assets are invested passively, is in thinking equities are attractive or unattractive based on the multiple for a given index, in this case, the S&P 500.
As discussed, likely to the point of exhaustion, at our investment committee meetings as well as in our prior missives, the multiple for the S&P as a whole is distorted by the most expensive names in the index, which is, arguably, where valuations have become stretched.
Graph Twelve

Moreover, let us disabuse everyone of the notion of the S&P as being “passive”; it is run by a committee. This committee recently decided to add Tesla (NADAQ: TSLA) at a 1% weight later this month; it will be 10% of the weight in the consumer discretionary sector. Love or hate the company or Elon Musk, the company’s forward P/E ratio of around 264 moves the S&P 500s multiple a few turns higher.
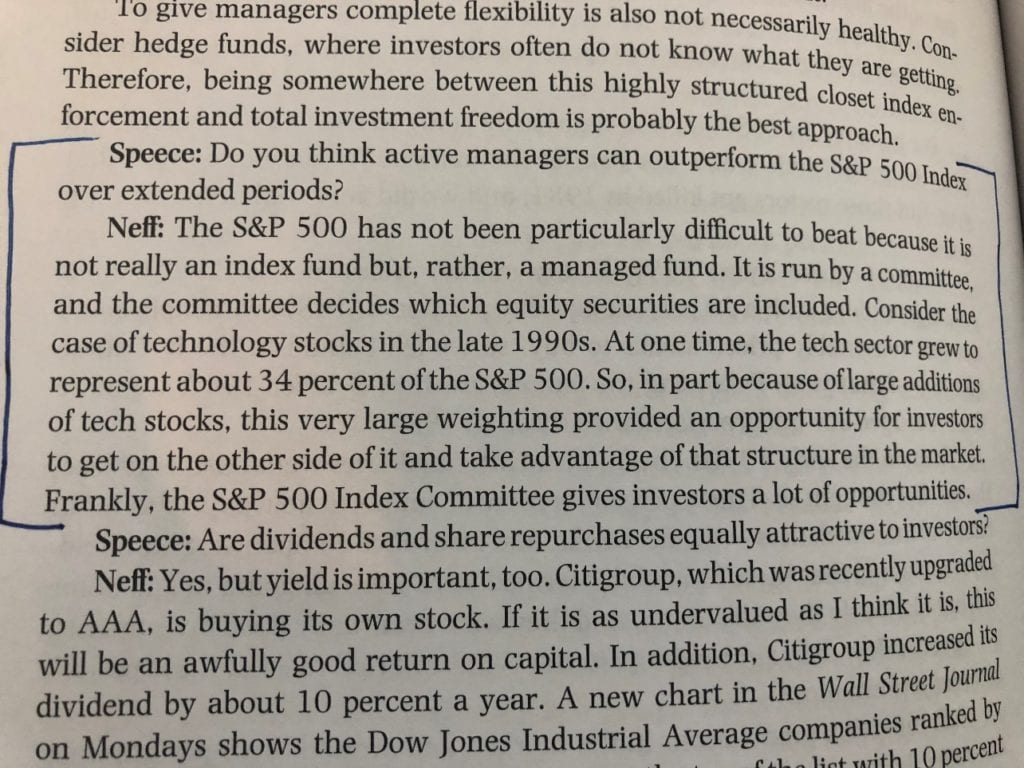
We recently took some items out of storage, including boxes of books, many unopened. As I was leafing through a pristine version of the 2006 version of the CFA Institute’s Global Perspectives on Investment Management and trying to lobby with my wife as to why we should keep a 14 year old book that had never been opened, I came across this passage:

Juxtapose this with what we are currently hearing from passive and evidence-based investors, who proclaim the infinite wisdom of the index. The key sentence: “Frankly, the S&P 500 Index Committee gives investors a lot of opportunities.”
All of this to say, now is a time when active management is more important than ever. The risk/reward profiles on the major bond and stock indices are poor. That is not to say we are looking for the egress, i.e., we are not exiting either equity or fixed income markets, but rather going forward being selective is going to be even more important. Along these lines, we will have an exciting announcement in the New Year regarding some innovative product development for use by Formidable’s clients, so stay tuned…just not in the theater.
Action Park is an interesting case study in seeing what happens when consumers take part in a service working under the assumption that the providers are: 1) looking out for the consumers’ safety; and 2) have at least a modicum of understanding the potential dangers associated with the product. Most investors would believe their advisors are looking out for them and understand the extent of risk involved in their investments. Unfortunately, that is not always the case. We don’t consider risks in the market to life-threatening, and we don’t write about Action Park to make light of o the people who were seriously injured or killed at the park. Rather, we use Action Park to illustrate how easily we all permit ourselves to be lulled into complacency when we trust that someone else has their hands on the wheel and is steering us safely through a treacherous path.
Often, the guardrails we believe to be in place are illusory at best. Risk is a part of life, but risk awareness and mitigation are what keeps us alive. As we continue to learn during these unprecedented times, many assume that just because the worst-case scenario as not come to fruition (yet?), risk awareness and/or mitigation is somehow unnecessary. Preparation and understanding will always be important. Knowing, understanding and either accepting or avoiding risk is an exceeding important aspect of investing (and living).
READY TO TALK?
